Expenditures by middle class households have increased by between 0.5 and 1 percent a year between 1997 and 2009. The share of income spent has changed very little.
After having examined how the size of the middle class has changed in Canada, Lauren Jones and I are looking at how expenditures among middle class families have changed over time. The graphs below use data from the Canadian Survey of Household Spending (SHS) between 1997 and 2009, and all figures are in 2009 dollars.
Miles Corak has documented the changes in average and median incomes among the middle class over the past 30 years. He found little improvements in incomes. We investigate whether expenditures have been equally stagnant.
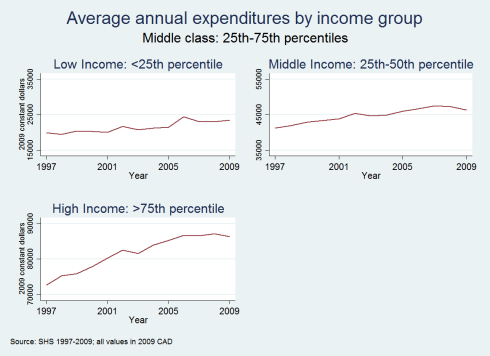
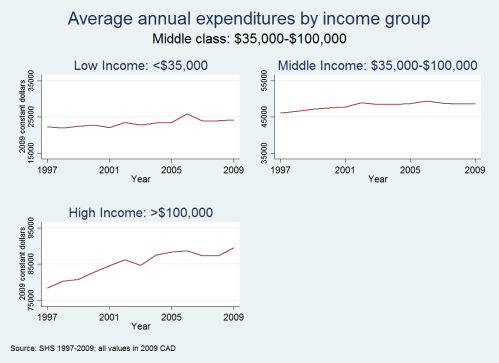
We look at expenditures among the entire population, as well as among middle class families. We compare results using two definitions of the middle class: first, using the New York Times definition of families that make between $35,000 and $100,000, and second, defining middle class as the middle 50 percent of the income distribution in any given year (those who fall between the 25th and 75th percentiles).
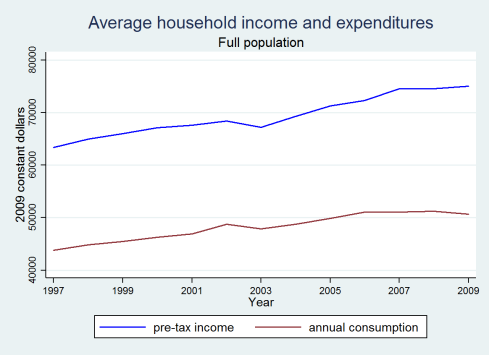
Across the whole population expenditures rose from $43,786 in 1997 to $50,653 in 2009 (16%). We include information on overall incomes measured in the SHS since 1997 as a reference point. Expenditures have risen slightly less than income in the general population.
However, expenditures among the middle class rose less than expenditures among the general population. Defined as the middle 50 percent of the population expenditures rose by $5159 (13%). Defined as families earning between $35,000 and $100,000, middle class expenditures rose by $2614 (7%). By contrast, expenditures for families earning in the top and bottom 25 percentiles increased by 18%, with high income expenditures climbing $13707 and low income expenditures climbing $3597.
Overall, expenditures increased by 1.0% a year for the middle 50 percent of the population and 0.47% a year for those earnings between $35,000 and $100,000.
Using either definition, the share of income that families spend has not changed significantly over time. Families in the middle 50 percent spend about 77 percent of their income, and families earning between $35,000 and $100,000 families went from spending 73% to 75% of their income. High income families only spent about 55 percent of the pre-tax income, while low income families spend more than their pre-tax incomes (since many of these families receive significant transfers through tax benefits).
This is an ongoing research project at the Martin Prosperity Institute.