This report examines job growth across Canada and the United States. It uses data from Emsi data for the period 2001–2016 for the 222 metros that had more than 100,000 jobs in 2016. This includes 203 U.S., 91 percent of the total, and 19 Canadian metros, 9 percent of them. We also look at job change for the more recent 2012–2016 post-economic crisis and recovery period. (Emsi compiles its labor market analytics from U.S. and Canadian government sources).
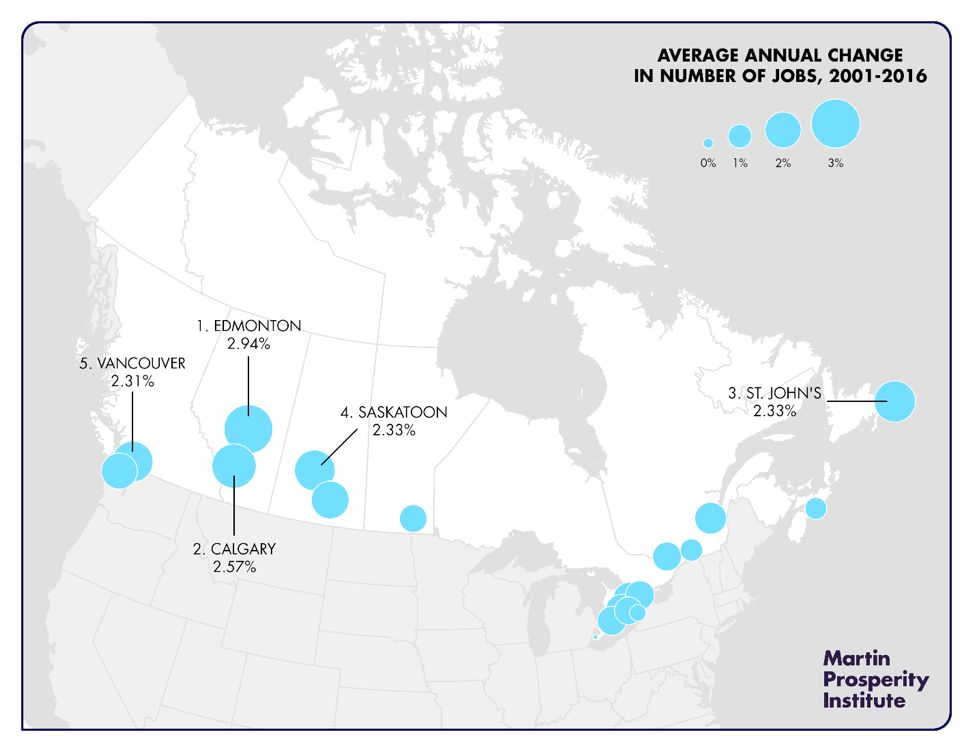
Exhibit 1 charts the annualized rate of job change for Canadian metros from 2001–2016.
Exhibit 1: Job Change in Canadian Metros, 2001–2016
High Job Growth
Just a small number of metros across the two countries saw high rates of job growth of more than 2 percent per year (Exhibit 2). All told, less than ten percent of metros (just 20 metros of 222 metros or 9 percent) saw growth of 2 percent of more per year from 2001 to 2016.
Exhibit 2: Annualized Job Change for Canadian and U.S. Metros, 2001–2016
2% plus | ||||||||
1 to 1.99% | ||||||||
0 to 0.99% | ||||||||
Less than 0% | ||||||||
Total |
But, Canadian metros performed significantly better than their U.S. counterparts in terms of job gains, with nearly a third (31.6 percent) of them falling into this high job growth group, compared to just 6.9 percent of the U.S. metros.
Indeed, Canada’s metros performed as well as many of the fastest growing U.S. Sunbelt metros. Edmonton and Calgary had job growth on par with the booming U.S. tech hub of Austin; Vancouver, St. John’s, and Saskatoon each had job growth that was better than Raleigh-Durham in the North Carolina Research Triangle or Orlando; while Regina’s job gains were similar to Orange County (Riverside-San Bernardino, CA).
Modest Job Growth
A much larger percentage of Canadian metros experienced modest job growth compared to their U.S. counterparts (Exhibit 3). Across the two nations, a quarter of all metros, 55 of them, saw more modest job growth of between one and two percent a year. But, almost half (47.4 percent) of Canadian metros fell into this group, compared to less than a quarter of U.S. metros.
Exhibit 3: Leading Metros on Job Growth, 2001–2016
| Metro | ||||
|---|---|---|---|---|
| Provo-Orem, Utah | ||||
| McAllen-Edinburg-Mission, Texas | ||||
| Greeley, Colorado | ||||
| Cape Coral-Fort Myers, Florida | ||||
| Edmonton, Alberta | ||||
| Austin-Round Rock, Texas | ||||
| Laredo, Texas | ||||
| Calgary, Alberta | ||||
| Fayetteville-Springdale-Rogers, Arkansas / Missouri | ||||
| Kennewick-Richland, Washington | ||||
| St. John's, Newfoundland | ||||
| Saskatoon, Saskatchewan | ||||
| Vancouver, British Columbia | ||||
| Fargo, North Dakota | ||||
| Raleigh, North Carolina | ||||
| Riverside-San Bernardino-Ontario, California | ||||
| Orlando-Kissimmee-Sanford, Florida | ||||
| College Station-Bryan, Texas | ||||
| Charleston-North Charleston, South Carolina | ||||
| Regina, Saskatchewan |
While Rustbelt metros in the U.S. have seen slow rates of job growth or even job decline, Canadian metros in and around the Great Lakes had rates of job growth that rival America’s high-flying Sunbelt metros. Toronto’s rate of job growth was comparable to Houston (1.79 percent vs. 1.91 percent), with both of them adding more than 600,000 jobs over this period. Kitchener/Waterloo’s 1.52 percent growth was comparable to Nashville (1.56 percent) or Dallas (1.50 percent); Hamilton (a metro that is often compared to Pittsburgh) had job growth of 1.33 percent, comparable to Phoenix (1.33 percent); and Winnipeg (1.31 percent) had job growth similar to Huntsville (1.30 percent).
Slow Job Growth
Canadian metros were much less likely to see slow job growth, of between zero and one percent over the period 2001–2016. Just under half (47.4 percent) of all metros across the two countries fell into this slow job growth category. But, a much greater share of U.S. metros, more than half (50.7 percent) experienced slow job growth compared to just 3 in Canada — Montreal (0.91 percent, 66th), Halifax (0.86 percent, 91st), and St. Catharines-Niagara (0.49 percent, 135th). These Canadian metros experienced job growth that is similar to many of America’s leading tech hubs that fall into this category: Washington DC (0.87 percent), San Francisco (0.65 percent), New York (0.59 percent), Boston (0.49 percent), and San Jose in the heart of Silicon Valley (0.32 percent).
Job Loss
Only one Canadian metro experienced job loss during this period, Windsor (-0.39 percent, 209th), whose manufacturing-based economy is heavily intertwined with that of Detroit (Exhibit 4). Overall, 41 metros or 18.5 percent saw job losses over this period. As the table below shows, the metros with the largest rate of job loss include mainly U.S. Rustbelt metros like Detroit, Flint, Youngstown and Dayton as well as New Orleans which suffered from Hurricane Katrina.
Exhibit 4: Metros with the Largest Job Losses, 2001–2016
| Metro | ||||
|---|---|---|---|---|
| Flint, Michigan | ||||
| Hickory-Lenoir-Morganton, North Carolina | ||||
| Youngstown-Warren-Boardman, Ohio/Pennsylvania | ||||
| Binghamton, New York | ||||
| Springfield, Illinois | ||||
| Atlantic City-Hammonton, New Jersey | ||||
| New Orleans-Metairie, Louisiana | ||||
| Charleston, West Virginia | ||||
| Detroit-Warren-Dearborn, Michigan | ||||
| Dayton, Ohio |
Post-Economic Crisis and Recovery
We now turn to the more recent period of economic recovery following the 2008 economic crisis, between the years 2012 and 2016. Now the picture changes somewhat.
Canadian metros do not perform as well versus their American counterparts. Part of the reason is that the economic crisis was felt much worse in the U.S., and U.S. metros thus experienced greater job gains as they rebounded from the crisis (Exhibit 5).
Exhibit 5: Job Change in Canada, 2001–2016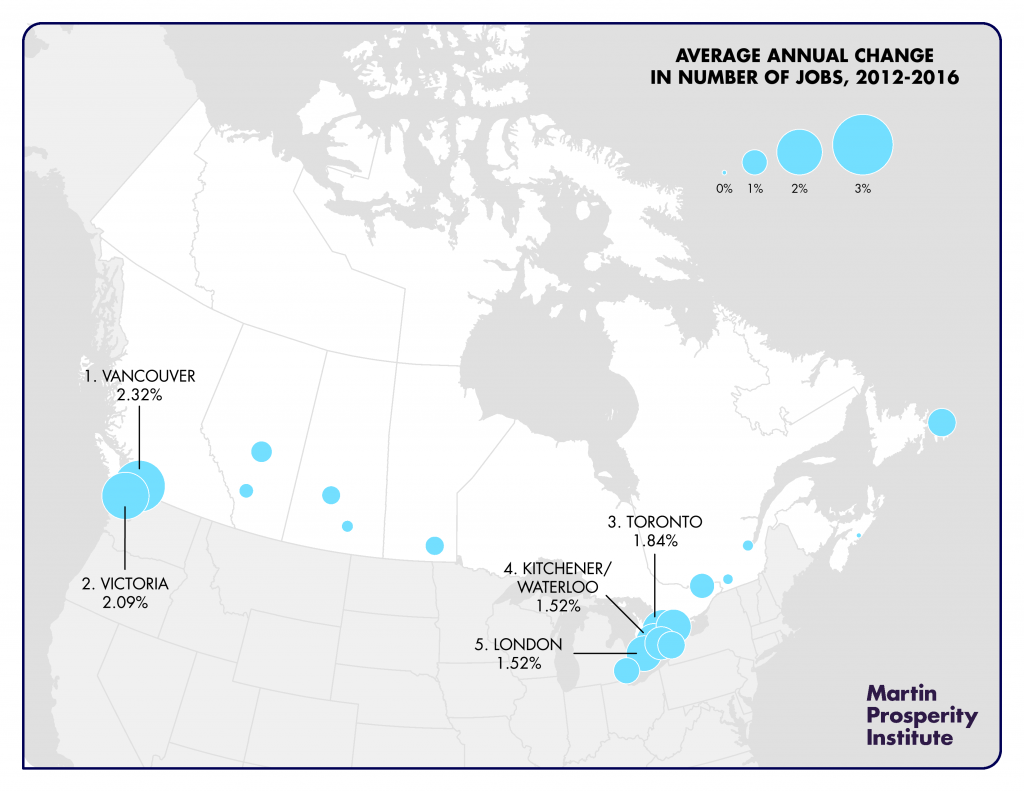

High Job Growth
Now a much larger share of metros, almost a third (32 percent) saw job growth of better than 2 percent per year, compared to less than ten percent of metros for the broader period (Exhibit 6).
Exhibit 6: Annualized Job Change for Canadian and U.S. Metros, 2012–2016
2% plus | ||||||||
1 to 1.99% | ||||||||
0 to 0.99% | ||||||||
Less than 0% | ||||||||
Total |
This group of high job growth metros includes just 2 Canadian metros — Vancouver and Victoria — compared to a third of U.S. metros. As the table below shows, all ten of the leading job growth metros are in the U.S..
Modest Job Growth
A larger share of Canadian metros (40 percent) saw modest job gains of 1 to 2 percent a year compared to roughly a third of U.S. metros (Exhibit 7).
Exhibit 7: Leading Metros on Job Growth, 2012–2016
| Metro | ||||
|---|---|---|---|---|
| Cape Coral-Fort Myers, Florida | ||||
| Provo-Orem, Utah | ||||
| Lake Charles, Louisiana | ||||
| Greeley, Colorado | ||||
| Naples-Immokalee-Marco Island, Florida | ||||
| Austin-Round Rock, Texas | ||||
| North Port-Sarasota-Bradenton, Florida | ||||
| Orlando-Kissimmee-Sanford, Florida | ||||
| Elkhart-Goshen, Indiana | ||||
| Fort Collins, Colorado |
Toronto’s job growth (1.84 percent, 79th) was comparable to Los Angeles (1.84 percent, 80th) and better than Boston (1.78 percent, 84th), New York (1.77 percent, 85th), or San Diego (1.70 percent, 89th). Kitchener/ Waterloo (1.52 percent, 102nd), London (1.52 percent, 103rd), Oshawa (1.50 percent, 109th), Hamilton (1.39 percent, 118th), St. John’s (1.16 percent, 135th), St. Catharines-Niagara (1.11 percent, 140th), and Windsor (1.05 percent, 149th) all fall into this category. Overall, a larger share of metros (37.4 percent) across the two nations experienced modest job gains compared to roughly a quarter for the broader period.
Slow Job Growth
Almost half (47.4 percent) of Canadian metros experience slow job growth of between 1 and 2 percent per year compared to 22.7 percent of U.S. metros. This group includes Edmonton (0.82 percent), Quebec City (0.30 percent job gain, 196th), Montreal (0.28 percent, 197th), and Halifax (0.01 percent, 209th) in Canada; and Washington DC (0.92 percent) falls into this group along with Buffalo (0.63 percent), Cleveland (0.62 percent), and Pittsburgh (0.02 percent) in the U.S.. Overall, a significantly smaller share of metros, roughly a quarter (24.8 percent) fell into the slow job growth category, compared to almost half for the broader period.
Job Loss
No Canadian metros experienced job loss between 2012–2016, compared to 13 U.S. metros that did (Exhibit 8). The metros with the biggest job losses include Atlantic City (-1.50 percent), resource and energy hubs like Lafayette (-1.41 percent) and Shreveport (-0.97 percent), coal towns like Huntington-Ashland (-0.55 percent), and smaller Rustbelt metros like Erie (-0.20 percent), and Youngstown (-0.10 percent). Overall, a smaller share of metros lost jobs, 6 percent compared with 18.5 percent in the broader period.
Exhibit 8: Leading Metros on Job Losses, 2012–2016
| Metro | ||||
|---|---|---|---|---|
| Atlantic City-Hammonton, New Jersey | ||||
| Lafayette, Louisiana | ||||
| Charleston, West Virginia | ||||
| Peoria, Illinois | ||||
| Shreveport-Bossier City, Louisiana | ||||
| Binghamton, New York | ||||
| Huntington-Ashland, WV-KY-OH | ||||
| Columbus, Georgia-Alabama | ||||
| Norwich-New London, Connecticut | ||||
| Erie, PA | ||||
| Fayetteville, North Carolina | ||||
| Anchorage, Alaska | ||||
| Youngstown-Warren-Boardman, OH-PA |
******
Canadian metros have significantly outperformed their U.S. counterparts in terms of job growth over the past decade and a half. Not just large metros like Toronto and Vancouver and the energy hub of Calgary, but smaller metros like Edmonton, St. John’s, Saskatoon and Regina saw job performance similar to booming places in the U.S. Sunbelt like Houston, Austin or Raleigh-Durham.
The pattern of job growth between metros in the two nations has converged in the wake of the economic crisis, however, as U.S. metros have recovered and registered improved job performance. Still, Vancouver posted better job gains than Houston and Toronto outperformed LA, New York and Boston. No Canadian metro lost jobs over this period, while 13 U.S. metros did.
Indeed, job performance across the two countries also belies some popular memes such as “the Frostbelt is losing jobs” and “the Sunbelt is gaining employment.” As we have seen Toronto’s job performance was on pace with Houston’s and many smaller Canadian Rustbelt metros also registered impressive job gains.
Job growth remains concentrated or “spiky” across the two nations. Fewer than ten percent of metros across the U.S. and Canada saw growth of 2 percent of more per year over the past 15 years.
More disturbingly, nearly a fifth of metros across the two countries actually lost jobs over this period, with job losses heavily concentrated in hard-hit industrial mainly in the U.S. Rustbelt. While U.S. metros’ job performance improved after the Great Recession, jobs gains remain uneven.
As economic inequality — the gap between rich and poor — has grown, so too has geographic inequality — the divide between cities and metros. Talent, jobs and economic success have concentrated in a relatively small number of metros — something I call “winner-take-all urbanism,” as many more cities and metro areas fall further behind.
While attention continues to be focussed on economic inequality, geographic inequality is a deep and growing problem, one that helps to shape our political divides and the anti-urban backlash that flows from them.
Download this Report (PDF)