There has been increasing concern over rising inequality and the growth of “the 1 percent” of super-rich people who sit atop the global economy.i Although the world’s 1,826 billionaires make up just 0.00003 percent of the global population, with a combined wealth of more than $7 trillion in 2015, they wield incredible purchasing power. Yet very little empirical research on them and the fortunes exists.
The Geography of the Global Super-Rich, a new Martin Prosperity Institute study by Richard Florida, Charlotta Mellander, and Isabel Ritchie, seeks to change that. Using detailed data from Forbes on the world’s billionaires, the report examines to examine the geography of the super-rich across cities and metro areas.ii
The combined wealth of the world’s billionaires is comparable to Japan’s entire economy, the world’s third largest, and make up nearly 10 percent of the total economic output of the entire world.iii The world’s 50 wealthiest billionaires control $1.6 trillion, more than Canada’s economy, while the top 10 control $556 billion, roughly the economic size of Algeria or the United Arab Emirates (see Exhibit 1).
Exhibit 1: The Global Super-Rich by Major Global City and Metro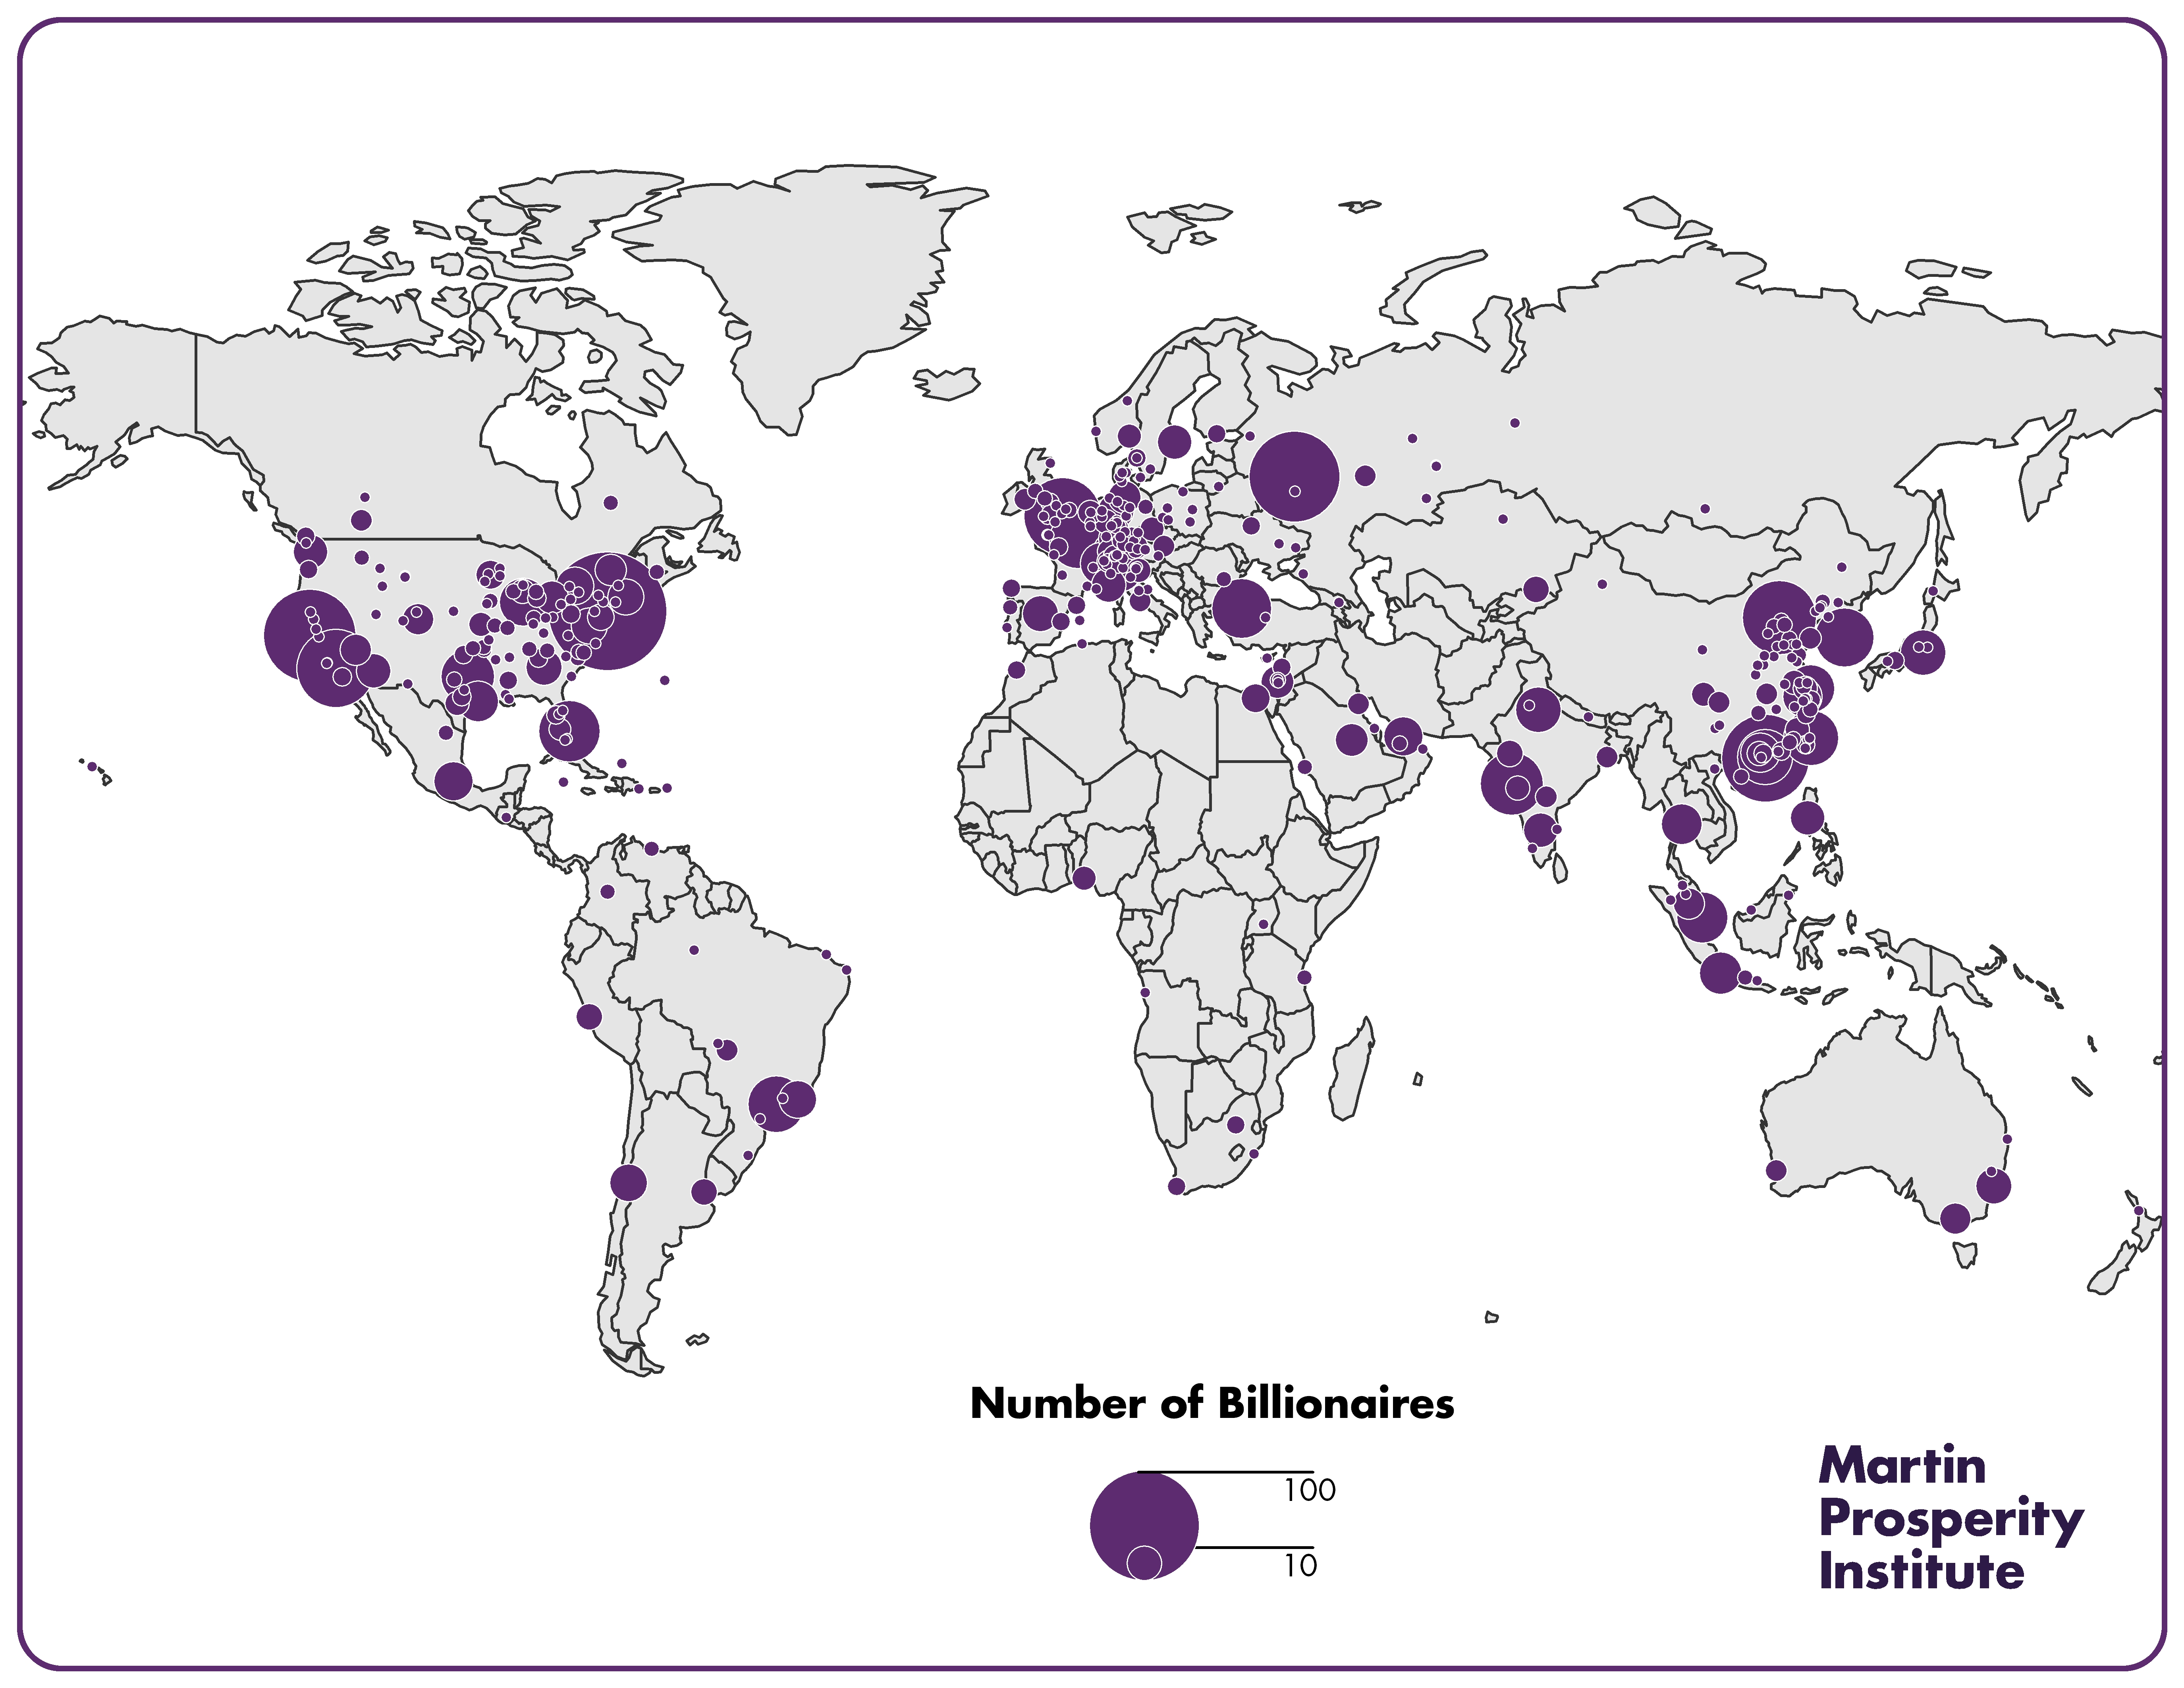
Looking at the cities where billionaires live, New York tops the list with 116 or 6.4 percent of the world’s billionaires (see Exhibit 2). The San Francisco Bay Area is second with 3.9 percent (71), Moscow third with 3.7 percent (68), and Hong Kong fourth with 3.5 percent (65). Three additional metros have between two and three percent of the global super-rich: Los Angeles (2.8 percent), London (2.7 percent), and Beijing (2.5 percent). Each remaining city in the top 20 accounts for between 1 and 2 percent of the world’s billionaires. Four of the top 10 global cities for the super-rich and six of the top 20 are in the United States.
Exhibit 2: Top 20 Metros of the Global Super-Rich
| Rank | Metro | Number | Share |
|---|---|---|---|
| 1 | New York | 116 | 6.4% |
| 2 | San Francisco Bay Area | 71 | 3.9% |
| 3 | Moscow | 68 | 3.7% |
| 4 | Hong Kong | 64 | 3.5% |
| 5 | Los Angeles | 51 | 2.8% |
| 6 | London | 50 | 2.7% |
| 7 | Beijing | 46 | 2.5% |
| 8 | Mumbai | 33 | 1.8% |
| 9 | Miami | 31 | 1.7% |
| 10 | Istanbul | 30 | 1.6% |
| 11 | Seoul | 29 | 1.6% |
| 12 | Paris | 27 | 1.5% |
| 12 | Sao Paulo | 27 | 1.5% |
| 14 | Shenzhen | 25 | 1.4% |
| 14 | Taipei | 25 | 1.4% |
| 16 | Dallas | 24 | 1.3% |
| 17 | Singapore | 22 | 1.2% |
| 18 | Chicago | 19 | 1.0% |
| 18 | Shanghai | 19 | 1.0% |
| 20 | Zurich | 18 | 1.0% |
The top 10 metros account for nearly a third (30.7 percent) of the world’s super-rich, while making up just 1.8 percent of the world’s population (see Exhibit 3). The top 20 account for more than 40 percent (43.5 percent), while making up just 3.5 percent of the world’s population. And the top 50 metros account for nearly two-thirds (63.6 percent) of the world’s billionaires, while making up just 7 percent (7.2 percent) of the world’s population.
Exhibit 3: Billionaire Wealth and the Number of Billionaires
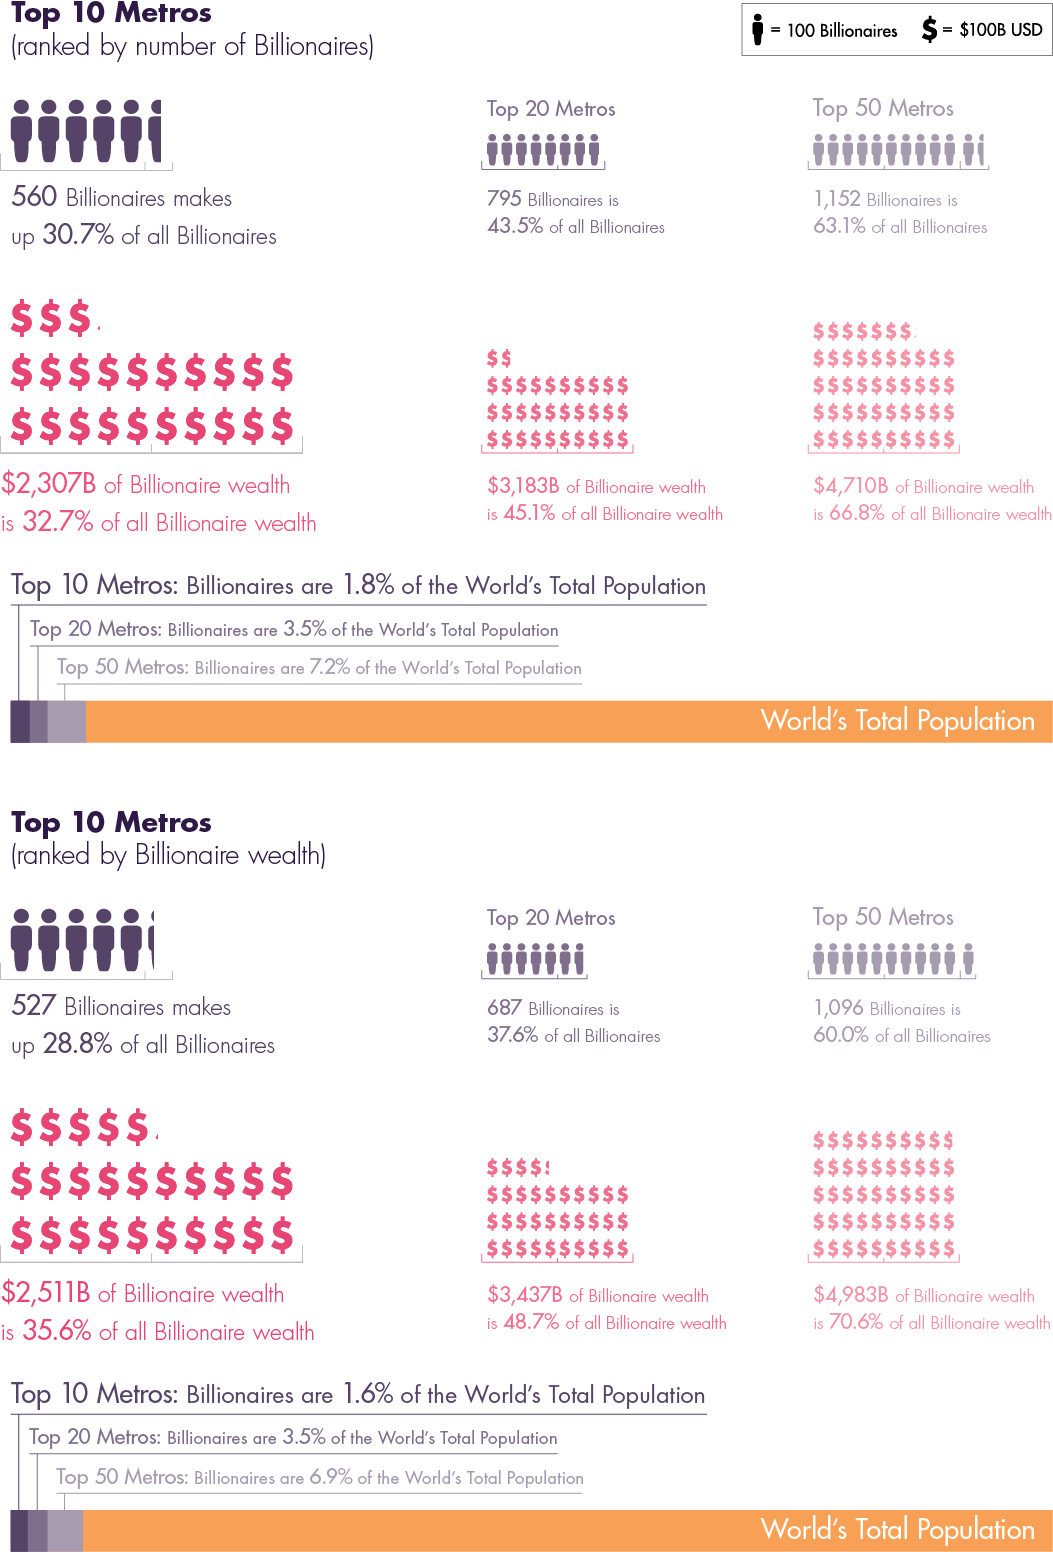
Looking at billionaire wealth, the top 10 metros control $2.5 trillion dollars, more than the total GDP of Brazil, Italy, or India. The top 20 metros account for $3.4 trillion, equivalent to the GDP of Germany, the world’s fourth largest economy. And the top 50 account for almost $5 trillion, a total that would make their combined wealth the equivalent of the world’s third largest economy, after the United States and China, and accounting for more than 70 percent of all billionaire wealth. Ultimately, the number of billionaires and their total wealth is closely associated across global metros, with a correlation of 0.87.
The geographic distribution of billionaires and their considerable wealth is spiky; it follows from the size and economic and financial power of global cities.
Download this Insight (PDF)
References
i See, Chrystia Freeland, Plutocrats: The Rise of the New Global Super-Rich and the Fall of Everyone Else, Doubleday Canada, 2012; Thomas Piketty, Capital in the Twenty-First Century, Cambridge, Massachusetts: The Belknap Press of Harvard University Press, 2014; Joseph E. Stiglitz, The Great Divide: Unequal Societies and What We Can Do About Them, New York: WW Norton & Company, 2015; Deborah Hardoon, Wealth: Having It All and Wanting More, Oxfam International, 2015, http://policy-practice.oxfam.org.uk/publications/wealth-having-it-all-and-wanting-more-338125; Ian Hay (ed), Geographies of the Super-Rich, Edward Elgar, 2013.
ii Several other studies make use of the Forbes data. See, Caroline Freund and Sarah Oliver, The Origins of the Superrich: The Billionaire Characteristics Database, Peterson Institute for International Economics, Working Paper 16, February, 2016: http://www.iie.com/publications/interstitial.cfm?ResearchID=2917; Steven Kaplan and Joshua Rauh, “It’s the Market: The Broad-Based Rise in the Return to Top Talent, Journal of Economic Perspectives, 27, 3, 2013, pp. 35-56; Erik Hurst, Ming Ching Luoh, and Frank Stafford, “The Wealth Dynamics of American Families, 1984–94, Brookings Papers on Economic Activity, 1, 1998, pp. 267–337; Anders Klevmarken, Joseph P. Lupton, and Frank P. Stafford, “Wealth Dynamics of the 1980s and 1990s: Sweden and the United States,” The Journal of Human Resources, 38, 2, 2003, pp. 322–53; Sutirtha Bagchi and Jan Svejnar, Does Wealth Inequality Matter for Growth? The Effect of Billionaire Wealth, Income Distribution, and Poverty, Institute for the Study of Labor, Bonn, Germany, IZA Discussion Paper No. 7733, 2013; Aditi Gandhi and Michael Walton, “Where Do India’s Billionaires Get Their Wealth? Economic and Political Weekly, 47, 40, October 2012, pp. 10–14; Sergei Guriev and Andrei Rachinsky, “The Role of Oligarchs in Russian Capitalism,” Journal of Economic Perspectives, 19, 1, 2005, pp. 131–50.
iii Data on economic output are from “Gross Domestic Product,” World Bank World Development Indicators Database, September 18, 2015, http://databank.worldbank.org/data/download/GDP.pdf.