Capitalism is in the midst of an epochal transformation from its previous industrial model to a new one based on creativity and knowledge. In place of the natural resources and large-scale industries that powered the growth of industrial capitalism, the growth of creative capitalism turns on knowledge, innovation, and talent. Growth and prosperity turn on a new model we term the 3Ts of economic development — talent, technology,and tolerance.
The Global Creativity Index, a new Martin Prosperity Institute study by Richard Florida, Charlotta Mellander, and Karen King, presents a broad-based measure for advanced economic growth and sustainable prosperity based on the 3Ts of economic development. It rates and ranks 139 nations worldwide on each of these dimensions and on our overall measure of creativity and prosperity, the Global Creativity Index.
The Global Creativity Index
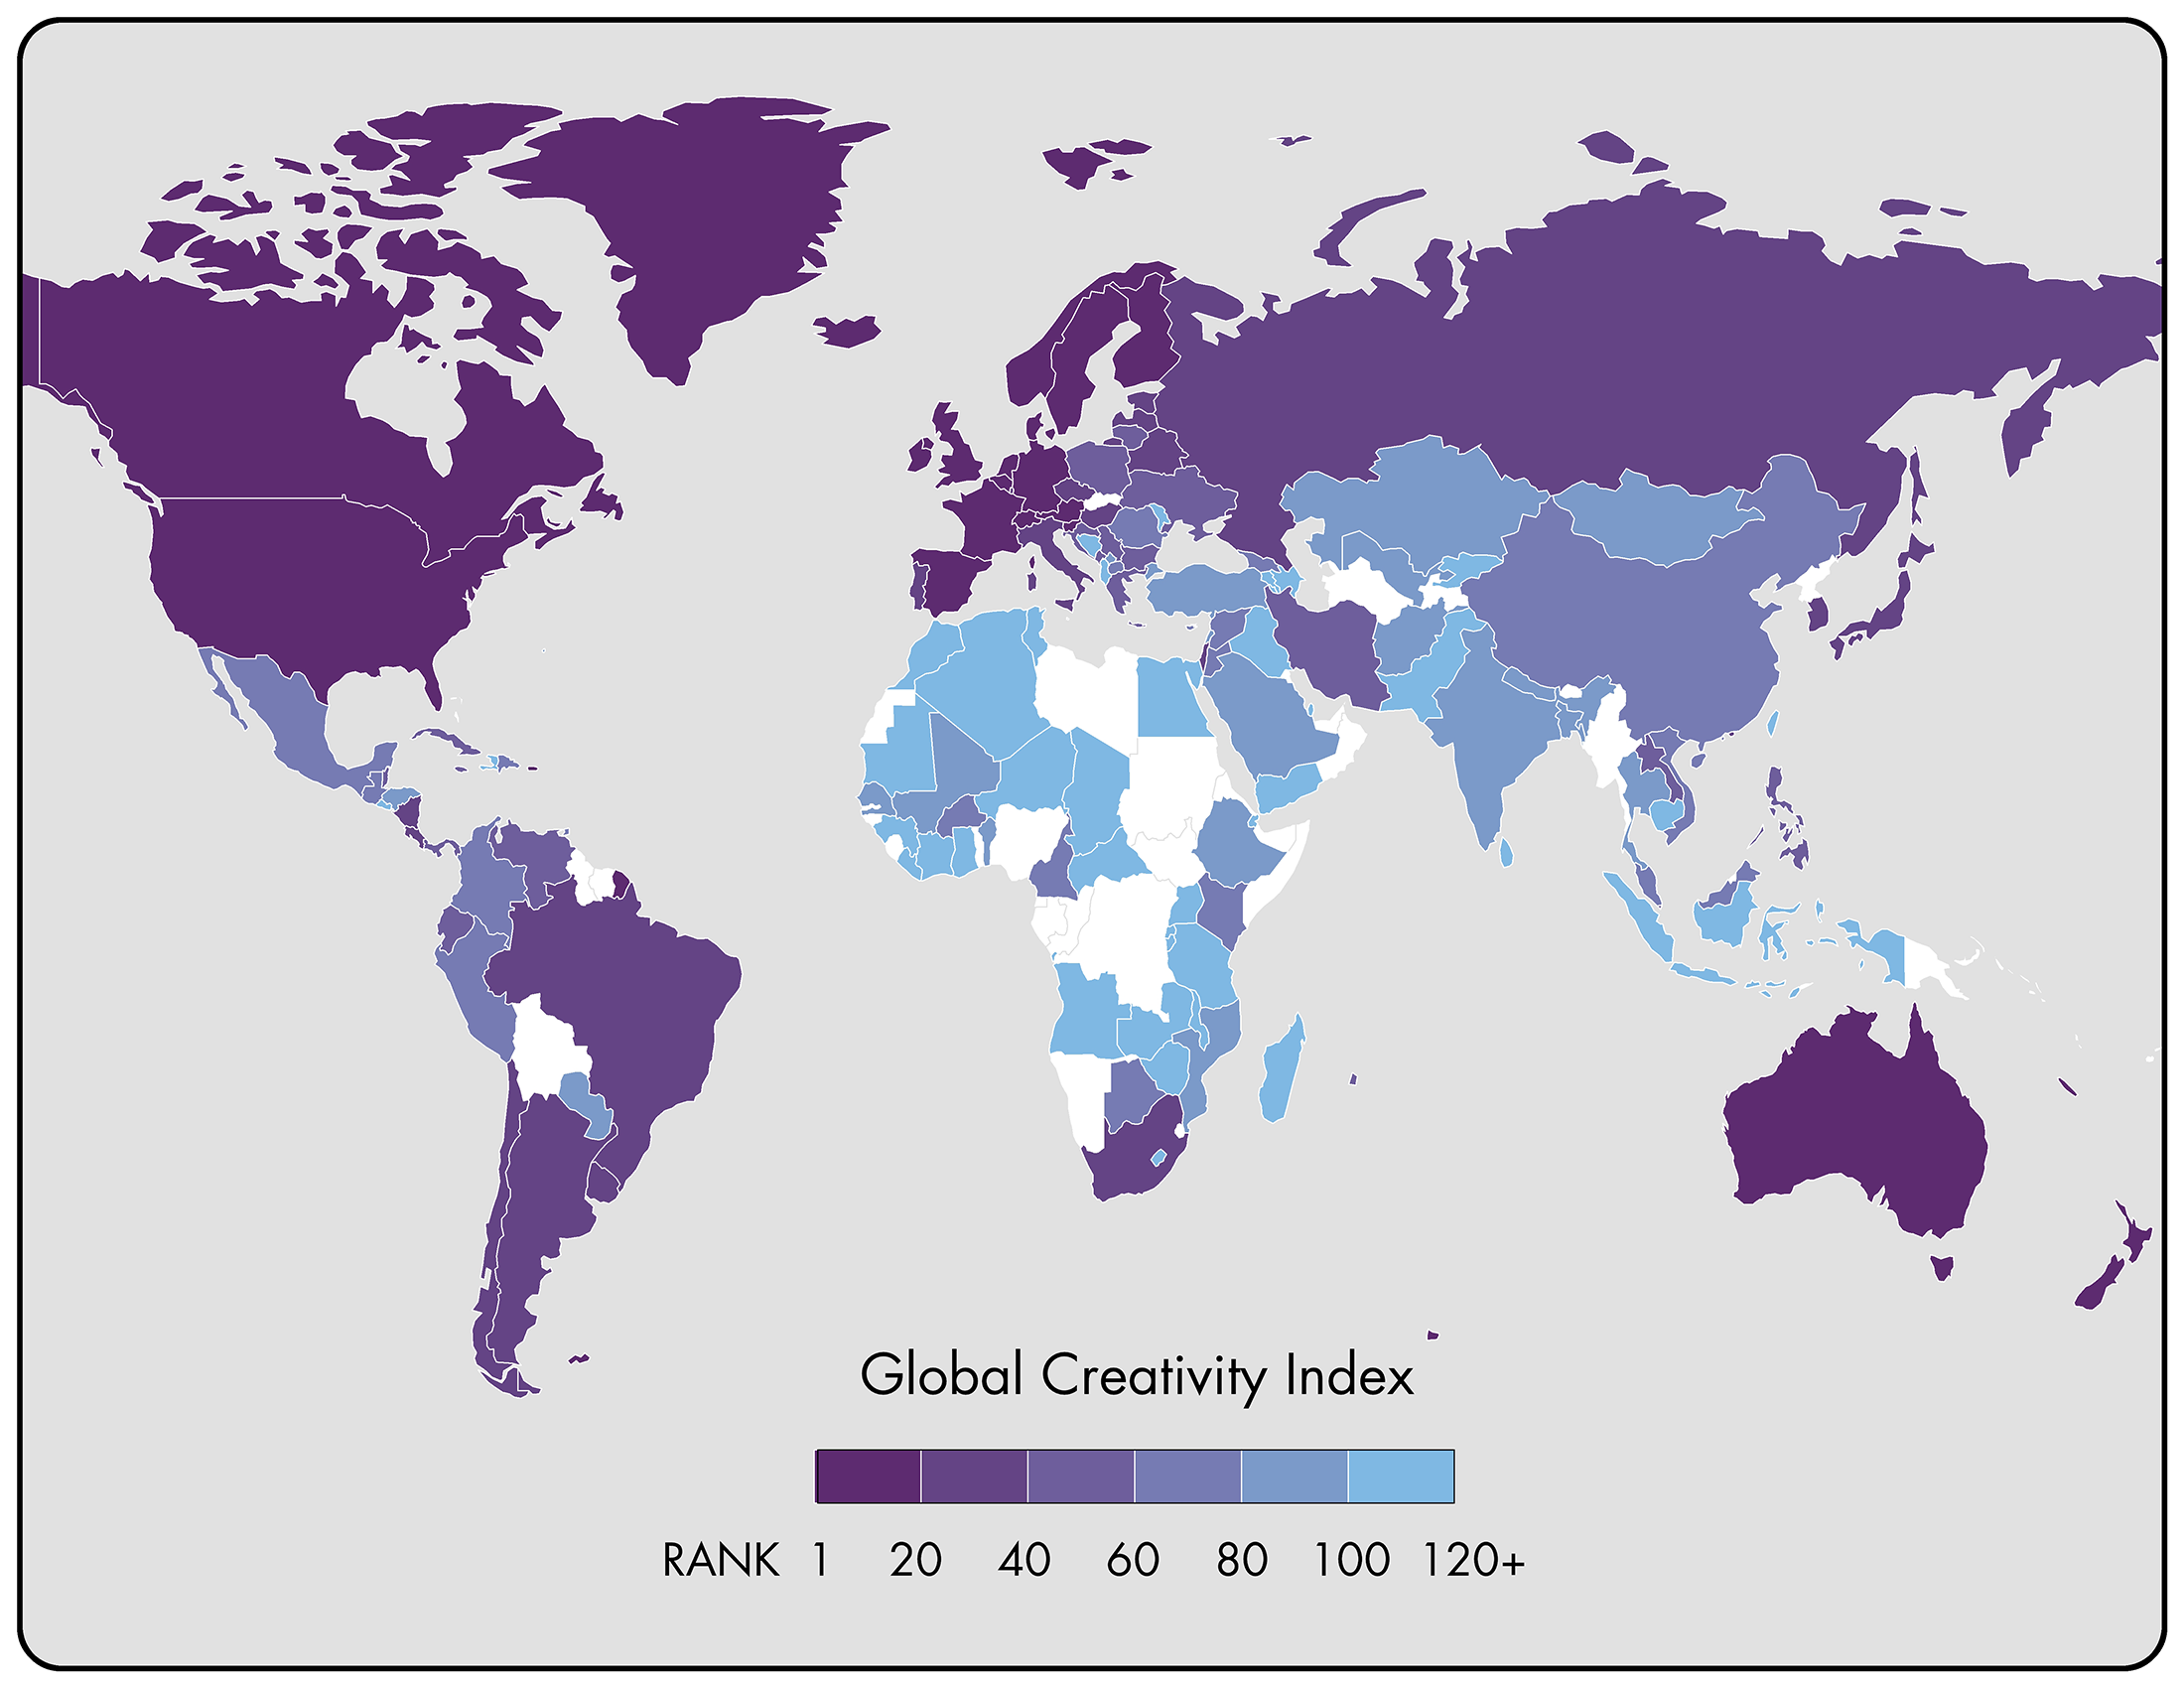
The Global Creativity Index, or GCI, is our combined measure of creative economic performance based on all 3Ts. The map below shows how the nations of the world stack up on the GCI.
Australia takes the number one ranking on the GCI. The United States is second, New Zealand third, and Canada fourth. Denmark and Finland are tied for fifth. The rest of the top ten include Sweden in seventh, Iceland eighth, Singapore ninth, and the Netherlands tenth.
Talent: Talent is a driving force in economic growth. The Global Talent Index combines our measure of the creative class with a measure of educational attainment based on enrollment in post-secondary, or tertiary education.
Australia is first on the Global Talent Index, followed by Iceland, the United States, Finland, and Singapore. Denmark, Slovenia, Belarus, New Zealand, and Sweden make up the rest of the top 10.
Creative Class: Luxembourg has the largest share of the creative class (54 percent), which spans science and technology; arts and culture; and business, management and the professions. Bermuda is second (48 percent), and Singapore is third (47 percent), down from first in 2011. Switzerland is fourth (47 percent) and Iceland is fifth (45 percent). Rounding out the top ten are Australia (45 percent), Sweden (45 percent), the Netherlands (44 percent), Canada (44 percent), and the United Kingdom (44 percent). The United States is 34th with 33 percent.
Technology: Technology is a fundamental driver of innovation and the growth of the knowledge economy. The Global Technology Index is based on two measures: the standard measure of R&D effort (the share of GDP devoted to R&D) and the standard measure of innovation (patents).
South Korea takes the top spot on the Global Technology Index. Japan is second, Israel third, the United States fourth, and Finland fifth. Australia, New Zealand, Germany, Singapore, and Denmark round out the top ten.
Tolerance: Tolerance is the third T. Tolerance acts on economic development by helping to establish the broad context for both technological innovation and talent attraction. Places that are open to different kinds of people gain an edge in both attracting talent from across the spectrum and mobilizing new ideas. Tolerance thus forms an additional source of economic advantage that works alongside technology and talent. The Global Tolerance Index is based on two measures: openness to ethnic and religious minorities and openness to gay and lesbian people.
Canada takes the top spot in tolerance. Iceland is second, New Zealand third, Australia fourth, and the United Kingdom fifth. The Netherlands, Uruguay, Ireland, Norway, and Sweden round out the top ten.
Creativity and Prosperity
In the new knowledge economy, creativity is closely linked with economic and social progress. Countries that rank high on the GCI are more likely to have high levels of economic output, competitiveness, entrepreneurship, and overall human development. Creativity is also closely associated with urbanization, with more urbanized nations scoring higher on the GCI.
Overall, we find that nations that score high on the GCI have, on balance, greater levels of equality. While some countries, like the United States and the United Kingdom, achieve high GCI scores alongside relatively high levels of inequality, in general, higher levels of global creativity are associated with lower levels of inequality. Nations that invest in creativity have more equal societies and, conversely, more equal societies tend to invest more in creativity. Harnessing creativity can help to mitigate the increasing global inequality that many countries currently experience.
There are two distinctive paths to balancing creative economic growth and inequality. The high road path of the Scandinavian nations combines high levels of creative competitiveness with relatively low levels of inequality. The low road path of the United States and the United Kingdom combines high levels of creative competitiveness with much higher levels of inequality.
What it boils down to is that nations can essentially choose to take the high road or low road paths. Ultimately, our research suggests that a high-road path to prosperity where the fruits of economic progress are more broadly shared is not only possible, but that it can actually lead to better economic performance.
Download this Insight (PDF)