This report is a non-technical summary of a new working paper by the authors: “Child Cash Benefits and Family Expenditures: Evidence from the National Child Benefit” available through the National Bureau of Economic Research, www.nber.org.
Download this Report (PDF)
Programs designed to transfer income to low-income families are common in many jurisdictions. The National Child Benefit (NCB) and Canadian Child Tax Benefit (CCTB) in Canada, the Earned Income Tax Credit in the United States, and the Working and Child Tax Credits in the UK are some examples. Each of these programs provides cash transfers that can be spent at the discretion of the recipient, and they tend to be either exclusively available to families with children or more generous for such families. While such programs often have multiple goals, one common policy aim is to improve the lives and chances of children in these families, and to lift them out of poverty.
There is an increasing amount of research that shows that these programs are successful in helping low-income families. They improve children’s performance in school, they improve child (and maternal) mental health, and they even have positive benefits for kids’ physical health.1 The question of how transfer programs achieve these results remains unanswered. How, exactly, do families spend transfer income in order to improve the outcomes of children? This paper summarizes recent research that we have conducted and provides some evidence on how families actually spend the money they receive. The results give some insight into how providing money to low-income families helps improve outcomes for children.
Economists, sociologist, and child psychologists have suggested two ways in which children can benefit from these types of transfers. On the one hand, families may use the income to purchase those goods and services that are directly related to improving education and health outcomes. If families use additional income to purchase direct inputs to education or health, such as tuition, reading materials, health care or nutritious food, improvements in these areas are likely to occur. Previous research has labeled this the “resources channel” (Mayer 1997, and Yeung et al. 2002).
On the other hand, income transfers may improve health and education outcomes indirectly if additional income reduces stress and improves household relations, increases the chance and opportunities for employment and eases financial burdens. Spending in areas like housing, recreation, or clothing, for example, may improve general health and education indirectly by improving the conditions children face and their ability to function, learn, and improve themselves. Previous research has called this the “family process” channel (Yeung et al. 2002). Recent research by Janet Currie and Mark Stabile has documented a strong relationship between early child mental health and both short-term educational achievement and longer-term economic outcomes such as welfare take-up. As such, the possibility that a broader set of expenditures, not necessarily immediately related to education, might also improve future educational outcomes is quite plausible.2
We investigate how families use income from the CCTB and NCB in Canada using twelve years of a Statistics Canada dataset, the Canadian Survey of Household Spending (SHS). The SHS is a nationally representative annual survey of Canadian families and is intended to measure spending habits. Respondents to the survey are asked to report their spending in the previous year on a wide array of spending categories. We choose to focus on categories grouped into four broad areas: education spending; health care spending; stability spending, including expenses like rent, clothing, food, transportation, child care and recreation; and spending on risky behaviour, including alcohol and tobacco purchases.
The Landscape of Benefits Programs in Canada
For readers unfamiliar Canada’s child benefit system, it consists of two main benefits. First, the Canada Child Tax Benefit (CCTB) is paid to parents of children age 0 to 17. This is a federal benefit initiated in 1993 that pays the same across the country with two small exceptions.3 The CCTB is payable for a twelve-month period running from July to June, with the amount dependent upon the reported net income of the parents in the previous calendar year. So, the July 2014 to June 2015 maximum annual benefit of $1446 per child was based on reported family net income from 2013. Benefits do not require any earned income, so families with no income still qualify for the benefit. Take-up is high—in many provinces the application is given to families of newborns and the administration is well-integrated with the tax system so any tax filer who qualifies will be made aware of the transfer. The benefit level was constant in nominal dollars between 1993 and 1999, but has been indexed to CPI inflation since 2000. A small supplement ($101 annually in 2014) is available for a third or higher order child. The federal benefit is therefore the same for all families with children, including non-workers, except that it varies by the number of children and begins a slow phase-out once an income threshold is reached.4
The second component of the child benefit system is the National Child Benefit program, begun in 1998.5 This program is a federal-provincial initiative that features a federally-paid benefit called the National Child Benefit Supplement (NCBS) equal to $2241 for a one child family, $1982/child for a two child family and $1886/child for families with three or more children in 2014. The federal government provided additional funding for an expanded benefit payment, but provinces, at their discretion, could subtract the NCBS from welfare recipients in their province and use the ‘savings’ to fund different provincial programs target to children. This yielded substantial differences in benefit amounts across provinces. In addition, the province of Quebec, while it elected to stay outside the NCB program, instituted major reforms of its child benefits system in 1997 and 2005. In short, two provinces introduced new transfers that weren’t related to earnings, two provinces introduced earnings-related benefits, and three provinces did both. Across provinces, there were large differences in the structure of benefits across family size. The provincial differences create variation in the flat federal benefit amount, the income threshold, and the reduction rate.
In addition, some provinces have provincially-funded and administered benefits. In particular, Manitoba and Quebec feature unique components to their system and British Columbia introduced a benefit very similar to the National Child Benefit Supplement two years before the rest of the country in 1996.
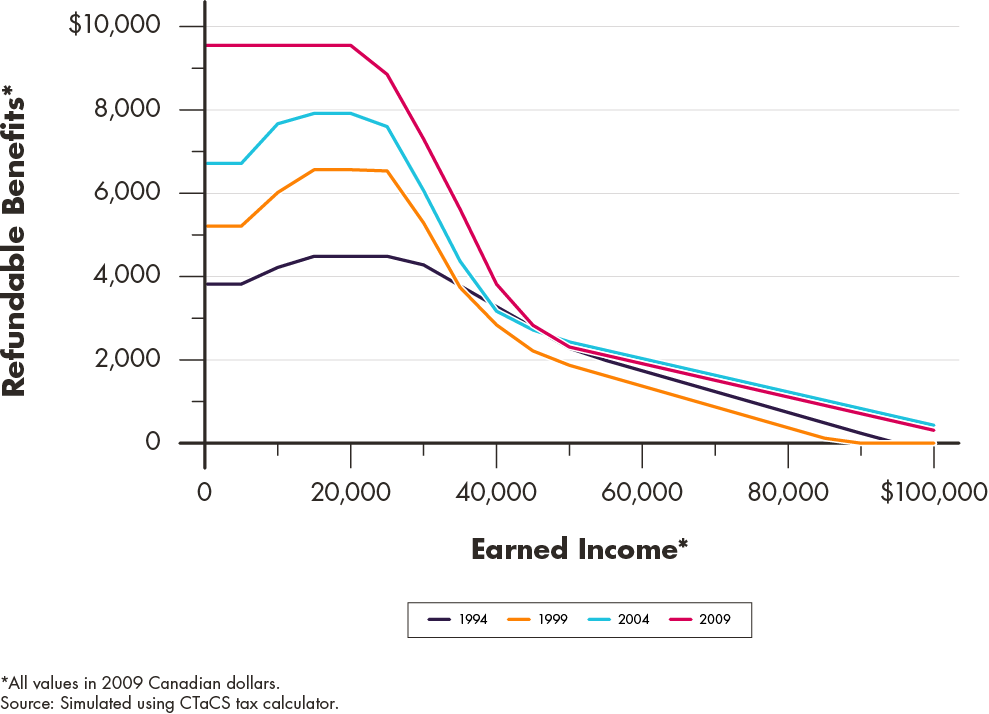
Figure 1 shows how the benefits for which a two-child two-parent family from Ontario would be eligible change over time. The values come from a tax and benefit simulator that calculates tax benefits and liability for different families.6 Importantly, much of the increase over time is focused on those at $10,000 and $25,000 income levels, through the expansion of the National Child Benefit program and the associated provincial program. Figure 2 shows how benefits for the same two-child family from Ontario evolve as earnings grow. The large jump between 1994 and 1999 results from the replacement of the $500 federal Working Income Supplement with the Ontario Child Care Supplement for Working Families paying $1100 per year. The further increase in 2004 results from the more-than doubling of the federal National Child Benefit Supplement in the first half of the 2000s.7 In short, there is significant variation in the amount of benefits for which different families are eligible.
Figure 1: Total benefits for an Ontario family with two children. Simulated benefits through time.
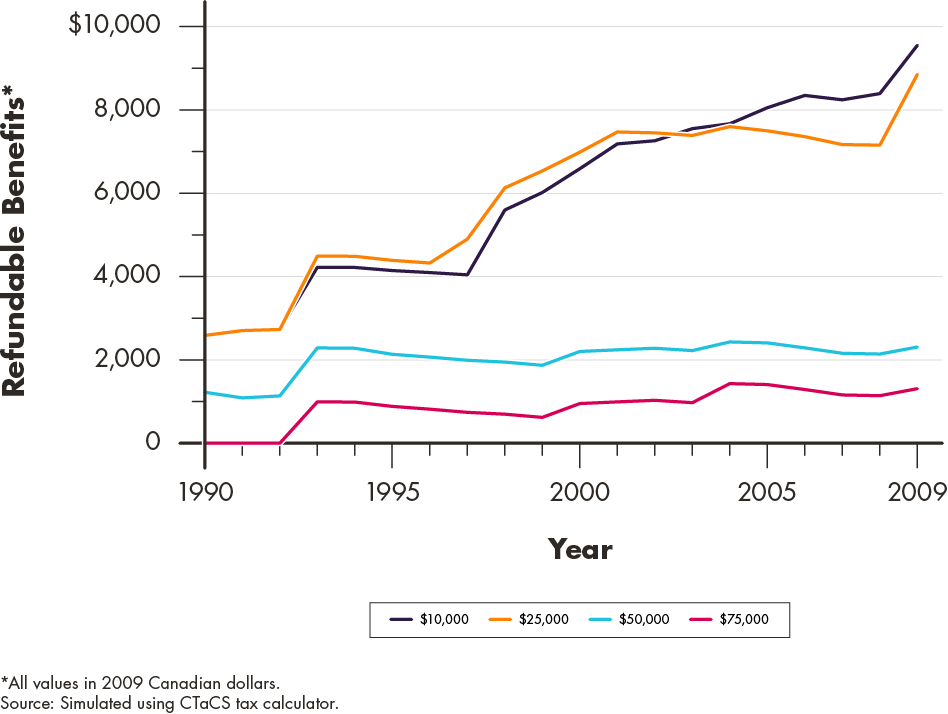
Figure 2: Total benefits for an Ontario family with two children. Simulated benefits by income levels.
Identifying How Families Spend Benefit Income
Our research explores how families spend additional income received from tax benefits. Ideally, to answer this question, we would take a sample of families and randomly assign them different levels of benefit income; we would then see how spending differed for families who received more or less benefit income, where the only determinant of their benefit income was the group to which they were assigned. This is the experimental ideal: think of it like a randomized control trial (RCT) to test the effects of a new medical treatment. Of course, the data we have does not allow us to complete a RCT of benefit income. We know the amount of benefit income a family received, and their spending, but the amount of benefit income a family receives is not randomly assigned – it is highly related to their income. Because families with less earned income receive more benefit income, using a simple analysis that relates spending to benefit income will not produce accurate results; such an analysis would simply show that families who receive more benefit income have lower spending, which is not the relationship that interests us.
To get around this selection problem, we use the fact that there is considerable policy variation over time, province and family size in the amount of benefits families receive. Importantly, this type of variation in benefit income is not related to any one family’s income; it is determined by government policy. Our methodology, which is described fully in Jones, Milligan and Stabile (2015), essentially approximates the experimental ideal by relating a family’s spending to the part of the variation in their benefit income that comes from government policy, ignoring the part that comes from the family’s earned income. The numbers we report below show how a family spends an additional dollar of benefit income that they have received because the government made their benefit more generous, not because their earned income was reduced. This solves the selection problem because it relates spending to changes in benefit income — government mandated changes — that should only affect spending by providing families more benefit income.
Resources or Process: How do Families Spend Benefit Income?
Our results reveal some interesting patterns and we present the most important ones in Table 1. There is evidence that, among low-income families, the benefits are used across a wide variety of expenditure categories, which provides evidence consistent with both the “resource channel” and the “family process channel” hypotheses. For example, we see increases in expenditures on food bought in stores, child care and transportation – general expenditures required by low-income families. For the sample of all families we see large declines in alcohol and tobacco use. While it is not possible to say for certain how these changes in spending patterns drive improvements in child outcomes, it is likely that benefit income may be helpful in reducing financial stress (and hence reducing consumption of items like alcohol and tobacco) thereby providing an improved learning environment for children. This is consistent with the family process channel hypothesis.
We also, however, observe direct investments in education and, to a lesser extent, health. We find increases in overall spending on education by low-income families as well as increases in spending on tuition and computer equipment in particular. Overall there is a clear pattern that some of the resources provided by benefit programs are being used to directly improve learning. This is consistent with the resource channel hypothesis.
Overall, families appear to be quite sophisticated in the way they spend their benefit income. They are purchasing more basic necessities, and as their resources increase, they are directing increasingly more of the money towards those items that directly affect learning, such as educational tools. Interestingly, they significantly cut back spending on alcohol and tobacco (in contrast to some anecdotal descriptions of how low-income families spend public money).8 These results provide some context to the observed success of these benefits on child outcomes.
The policy implications of the current work are important. Politicians continue to debate whether families can be trusted to spend unconditional transfers “responsibly”, or whether policy-makers are better off providing targeted transfer income that directs spending to certain areas. Our results imply that unconditional transfers are very well-spent: families appear to be using the income to enhance education and health production for children, and to improve the general living conditions of the family.
Variable average and change in amount spent for all families and low-income families
| Spending | All Families: Variable Average | All Families: Change in amount spent | Low-income families (Bottom quartile of income): Variable average | Low-income families (Bottom quartile of income): Change in amount spent |
|---|---|---|---|---|
| Total Spending | $48,269 | -0.290 | $26,627 | 0.376 |
| (25,363) | (0.411) | (13,501) | (0.253) | |
| Nondurable Spending | $23,550 | -0.077 | $13,879 | 0.446*** |
| (11,731) | (0.195) | (6,554) | (0.086) | |
Education Categories |
||||
| Tuition spending | $208 | 0.009 | $141 | 0.060** |
| (398) | (0.049) | (291) | (0.023) | |
| Education supplies | $667 | -0.003 | $388 | -0.001 |
| (2,160) | (0.007) | (1,619) | (0.005) | |
| Computers and equipment | $415 | 0.003 | $190 | 0.064*** |
| (843) | (0.018) | (534) | (0.018) | |
| Reading material | $254 | -0.005 | $110 | 0.008 |
| (310) | (0.009) | (161) | (0.007) | |
Health Categories |
||||
| Dental | $313 | -0.057** | $145 | -0.019* |
| (757) | (0.022) | (403) | (0.009) | |
| Eye care | $180 | 0.028* | $89 | 0.001 |
| (349) | (0.011) | (205) | (0.007) | |
| Prescription drugs | $199 | -0.018 | $172 | -0.004 |
| (479) | (0.013) | (432) | (0.011) | |
Stability Categories |
||||
| Rent | $6,096 | 0.171* | $5,369 | 0.147 |
| (3,524) | (0.085) | (2,853) | (0.103) | |
| Child care | $917 | -0.027 | $414 | 0.067* |
| (2,091) | (0.033) | (1,053) | (0.027) | |
| Food (not at restaurants) | $6,207 | 0.081* | $4,469 | 0.230*** |
| (2,900) | (0.039) | (2,239) | (0.035) | |
| Clothing | $2,967 | 0.008 | $1,556 | 0.043 |
| (2,492) | (0.050) | (1,319) | (0.042) | |
| Personal care items | $1,085 | -0.011 | $666 | -0.035** |
| (859) | (0.016) | (560) | (0.011) | |
| Transportation | $2,797 | 0.022 | $1,442 | 0.065** |
| (2,310) | (0.036) | (1,496) | (0.025) | |
| Recreation | $3,522 | -0.050 | $1,680 | 0.117** |
| (3,079) | (0.060) | (1,493) | (0.041) | |
Risky Categories |
||||
| Alcohol | $615 | -0.073*** | $278 | -0.004 |
| (959) | (0.021) | (573) | (0.009) | |
| Tobacco | $710 | -0.060*** | $675 | -0.002 |
| (1,286) | (0.018) | (1,070) | (0.031) | |
Sample sizes | 59,793 | 15,261 |
||
| Notes: * pRegressions using the Survey of Household Spending and instruments simulated from the Survey of Labour and Income Dynamics. Data from years 1997-2009. Regressors include gender, age and marital status of primary respondent, survey year, province, number of children dummies, and all second-order interactions of the year, province and number of children controls. Column (1) reports estiamtes from OLS models of the imputed benefit coefficients. Column (2) reports results where the SLID simulated benefits have been used as instruments from the imputed benefit amount. Robust standard errors clustered at the province level reported in parentheses. | ||||
Endnotes
1 Dahl and Lochner (2012) and Milligan and Stabile (2012) both find, for example, that these programs lead to improved outcomes for children, both in terms of math and reading skills, and in terms of mental and physical health measures. Hoynes, Miller and Simon (2015) find that the EITC improves infant health outcomes and maternal health behavior.
2 See for example, Currie and Stabile, 2009; Currie, Stabile, Manivong and Roos, 2008.
3 In Alberta, the benefit is differentiated by age of the child. For example, in 2014 children age zero to six received $1,333 while those age 16 to 17 received $1,687. Until 1997, benefits paid to Quebec residents depended on how many children were in the family, with higher-order children receiving more benefits. We account for each of these exceptions in our benefit calculator.
4 For 2014, the clawback threshold is $43,953, with a reduction rate of 2 percent for income over that threshold for one-child families, and 4 percent for two or more child families.
5 The National Child Benefit Supplement replaced the Working Income Supplement, which was in place from 1993 to 1997. See details in the Appendix.
6 We use the Canadian Tax and Credit Simulator (CTaCS). This is described in Milligan (2010). This is the simulation that will create the instrument used in this study.
7 The National Child Benefit Supplement annual rate for two-child families went from $1,370 in 1999 to $3964 in 2014.
8 One political strategist in Canada was famously lambasted for suggesting that expanding cash transfers to families would cause them to “blow” the income “on beer and popcorn” (CBC News 2005).
References
CBC News. 2005. “Federal Liberals deride ‘beer and popcorn’ money”. http://www.cbc.ca/archives/categories/politics/elections/fumbles-and-stumbles-eight-great-election-gaffes/liberals-deride-beer-and-popcorn-money.html Accessed on. April 2, 2015.
Currie, Janet and Mark Stabile. 2009. “Mental Health in Childhood and Human Capital.” In The Problems of Disadvantaged Youth: An Economic Perspective, ed. Jonathan Gruber, 149-180. Chicago: University of Chicago Press.
Currie, Janet, Mark Stabile, Phongsack Manivong, and Leslie L. Roos. 2010. “Child Health and Young Adult Outcomes.” Journal of Human Resources, 45(3): 517–548.
Dahl, Gordon B., and Lance Lochner. 2012. “The Impact of Family Income on Child Achievement: Evidence from the Earned Income Tax Credit.” American Economic Review, 102(5): 1927–1956
Jones, Lauren, Milligan, Kevin, and Mark Stabile, “Child Cash Benefits and Family Expenditures: Evidence from the National Child Benefit,” National Bureau of Economic Research Working Paper # 2015.
Mayer, Susan E. 1997. What Money Can’t Buy. Cambridge, Massachusetts and London: Harvard University Press.
Milligan, Kevin. 2010. Canadian Tax and Credit Simulator. Database, software and documentation, version 2010–1.
Milligan, Kevin, and Mark Stabile. 2011. “Do Child Tax Benefits Affect the Well-Being of Children? Evidence from Canadian Child Benefit Expansions.” American Economic Journal: Economic Policy, 3(3): 175-205.
Milligan, Kevin and Stabile, Mark, “The Integration of Child Tax Credits and Welfare: Evidence from the Canadian National Child Benefit Program,” 2007, Journal of Public Economics, 91(1-2), pp. 305–326.
Yeung, W. Jean, Miriam R. Linver, and Jeanne Brooks-Gunn. 2002. “How Money Matters for Young Children’s Development: Parental Investment and Family Processes,” Child Development, 73(6): 1861–1879.