Welcome to the Good Jobs Score 2016! This year the Score has a new look, as the project is now jointly-hosted between Zeynep Ton and the Martin Prosperity Institute. Professor Ton is a fellow of the Institute, working closely with MPI to reform democratic capitalism in the United States.
Like the 2015 Score, the Good Jobs Score continues to be an informative index of how companies design and manage their operations in a way that creates value for their customers and investors while offering good jobs to their employees. The Good Jobs Strategy is a sustainable business and operations strategy in which everyone — customers, employees, and investors — wins.
The Good Jobs Score was created with several goals in mind: from helping investors identify sustainable companies in a particular industry to customers looking to vote with their wallets at companies that provide great value while taking care of their employees. We also created the score to motivate companies to develop and report standardized measures of employee satisfaction, customer satisfaction and productivity. As explained in the methodology* section, the data used to develop the score are limited and have some drawbacks.
The Good Jobs Score was developed by Zeynep Ton and her students, and remains a prototype for the kinds of reporting that are possible. Please help us improve it by providing feedback!
Costco (NASDAQ:COST)
Costco is a publicly traded membership-only warehouse club. The chain’s 2015 US revenue totaled $84.4 billion, earned from 488 warehouses and 205,000 employees. Each Costco warehouse carries an average of 3,700 SKUs, with items ranging from produce to televisions. Costco’s stated mission or value proposition is to keep operating costs down and pass the savings on to their members.
Costco’s Good Jobs Score Overview |
||
|---|---|---|
| Overall Score: 9.1Overall Rank: #1 | ||
|
Customer/Employee Scores
|
Productivity/Customer Scores
|
Productivity/Employee Scores
|


Costco’s Customer Score |
||
|---|---|---|
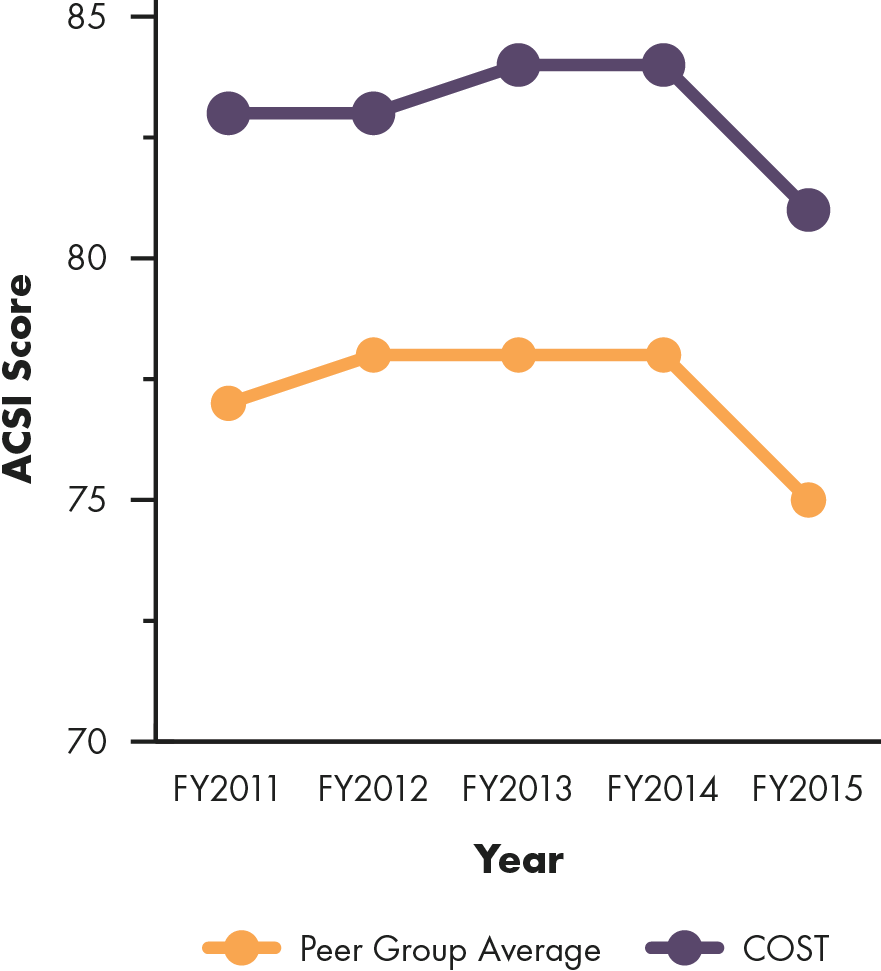
| Customer Score: 9.1Customer Rank: #3 | ||
| For 2016, the Good Jobs Customer component is composed of ASCI and Yelp scores. The 2015 score include Consumer Reports data, unavailable this year due it the biennial schedule of the report. Some companies only have two years of ACSI trend data – these companies are not tracked by the index; their scores are generated by predicting what their scores would have been using their relationship to Yelp data. |
ACSI Trend |
|
Costco’s Employee Score |
||
|---|---|---|
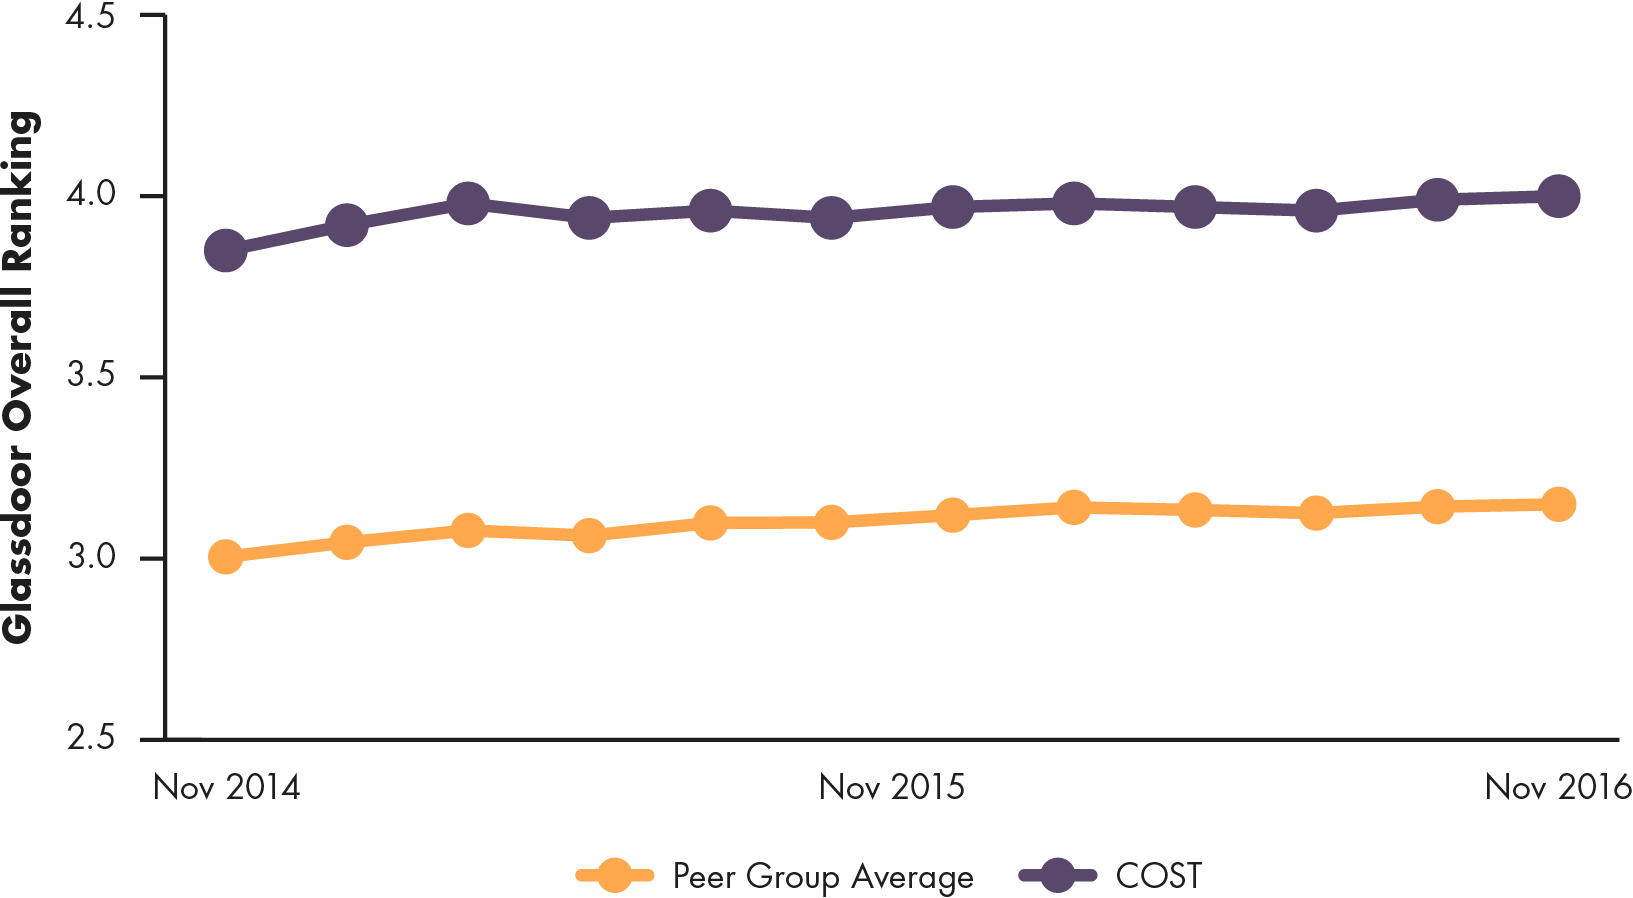
| Employee Score: 10.0Employee Rank: #1 | ||
| The Good Jobs Employee component is a composite of Glassdoor and Indeed scores (see Methodology for more details). Glassdoor provides a 2-year trailing score trend, republished here with the peer group average for comparison. |
Costco Glassdoor Rating Trend |
|
Costco’s Productivity Score |
||
|---|---|---|
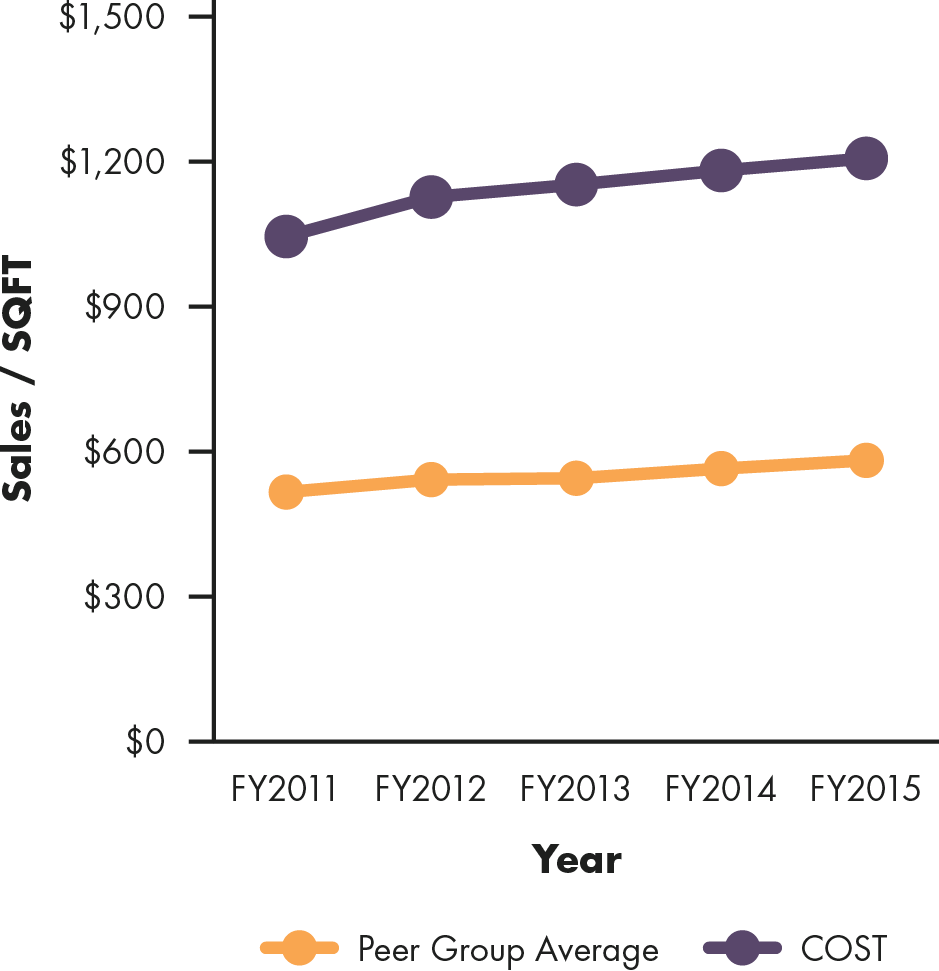
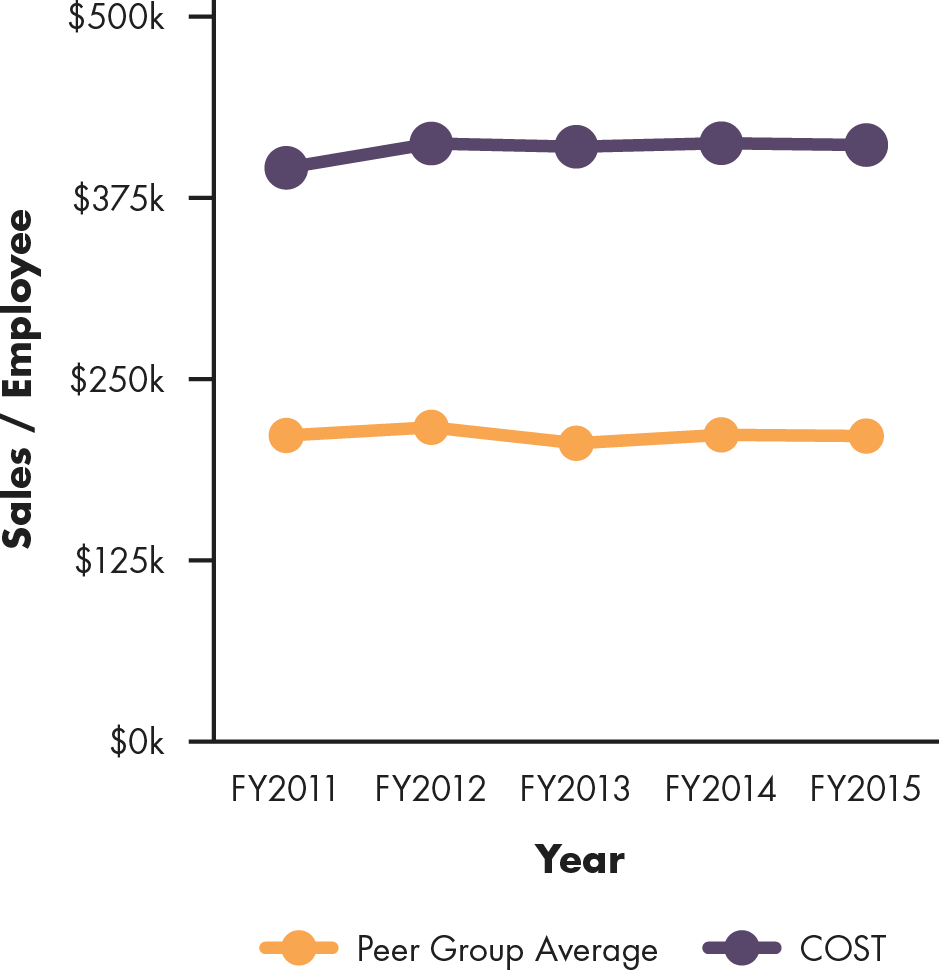
| Productivity Score: 8.2Productivity Rank: #1 | ||
|
Sales/SQFT
|
Sales/Employee
|
Inventory Turnover
|

Publix (OTCMKTS:PUSH)
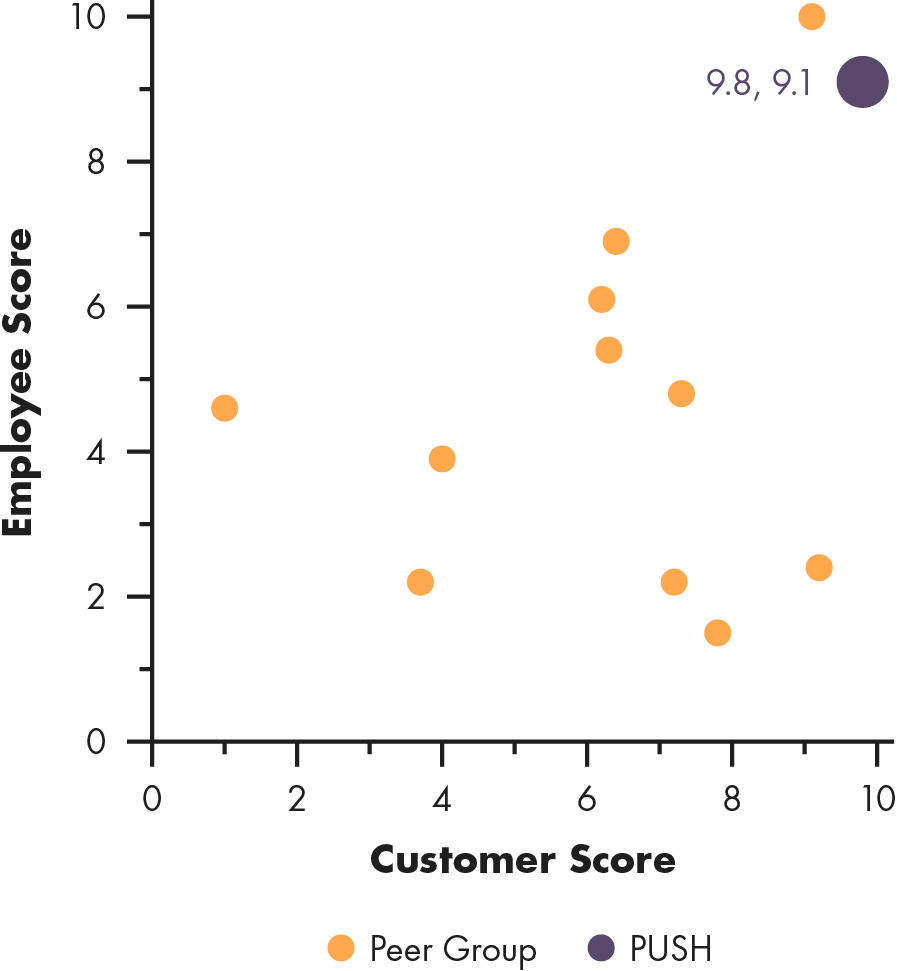
Publix is a grocery store chain. While listed on the OTC market, Publix shares are only held by current or past employees or their families. Despite its shares not available to the public, the company provides public reporting. 2015 revenue was more than $32 billion and it employed 180,000 people across 1,114 supermarkets. Publix does not report their average number of SKUs, but they carry an assortment of grocery items including fresh produce, flowers and gifts, health and beauty products, and housewares. Their stated mission is to focus on customer service, product quality, shopping environment, competitive pricing, and convenient locations.
Publix’s Good Jobs Score Overview |
||
|---|---|---|
| Overall Score: 6.8Overall Rank: #2 | ||
|
Customer/Employee Scores
|
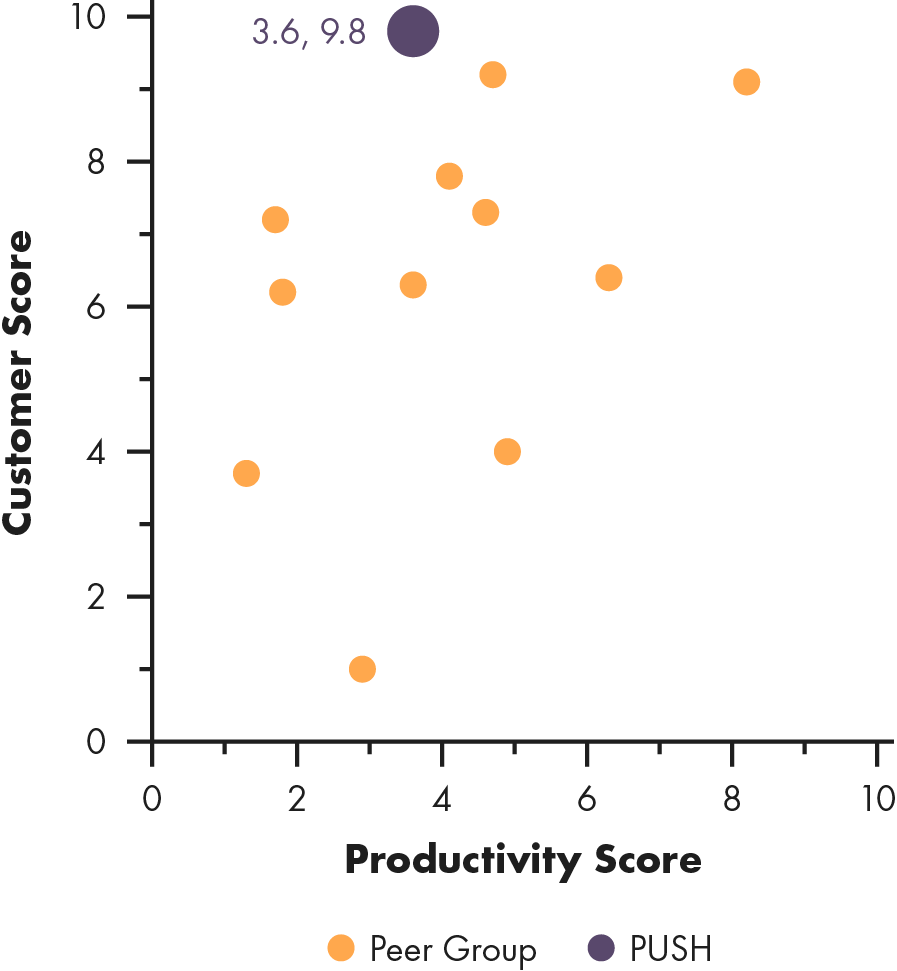
Productivity/Customer Scores
|
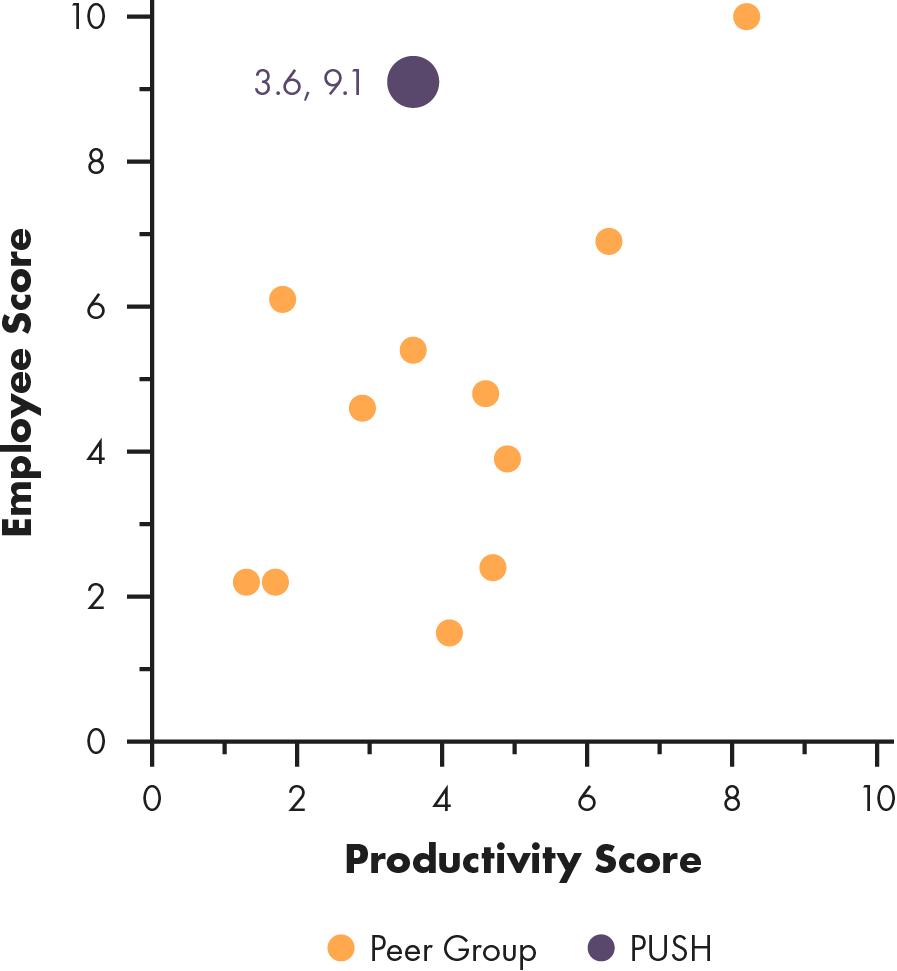
Productivity/Employee Scores
|
Publix’s Customer Score |
||
|---|---|---|
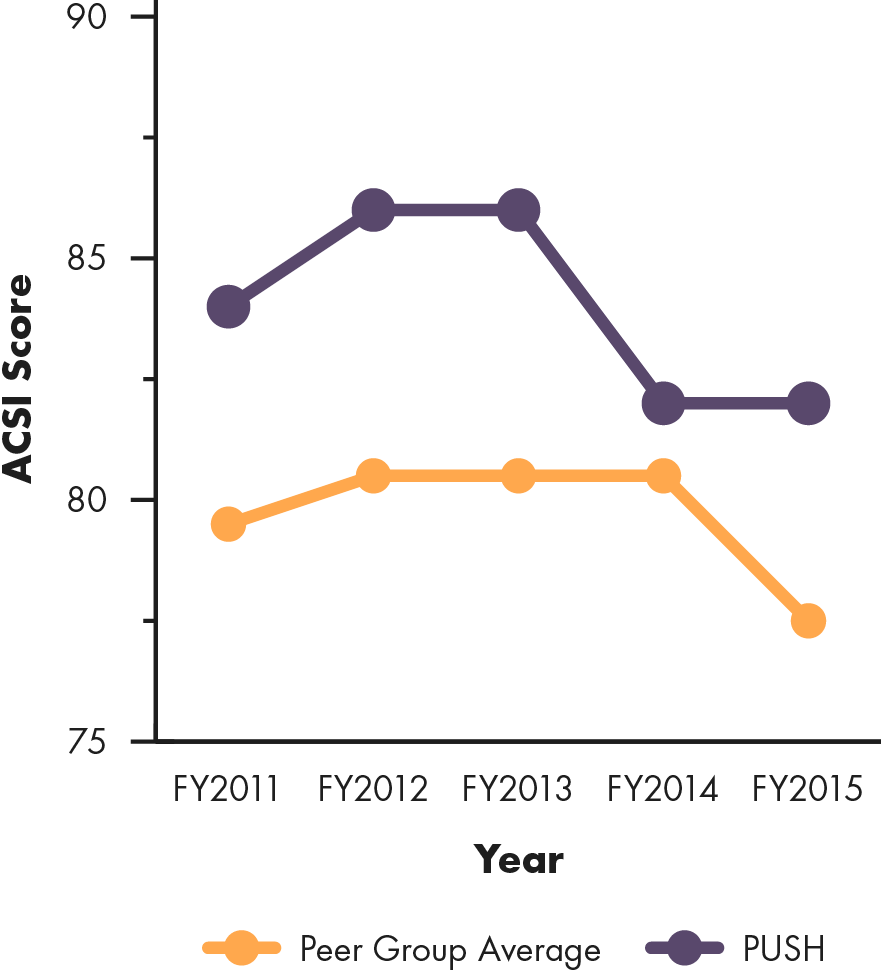
| Customer Score: 9.8Customer Rank: #1 | ||
| For 2016, the Good Jobs Customer component is composed of ASCI and Yelp scores. The 2015 score include Consumer Reports data, unavailable this year due it the biennial schedule of the report. Some companies only have two years of ACSI trend data – these companies are not tracked by the index; their scores are generated by predicting what their scores would have been using their relationship to Yelp data. |
ACSI Trend |
|
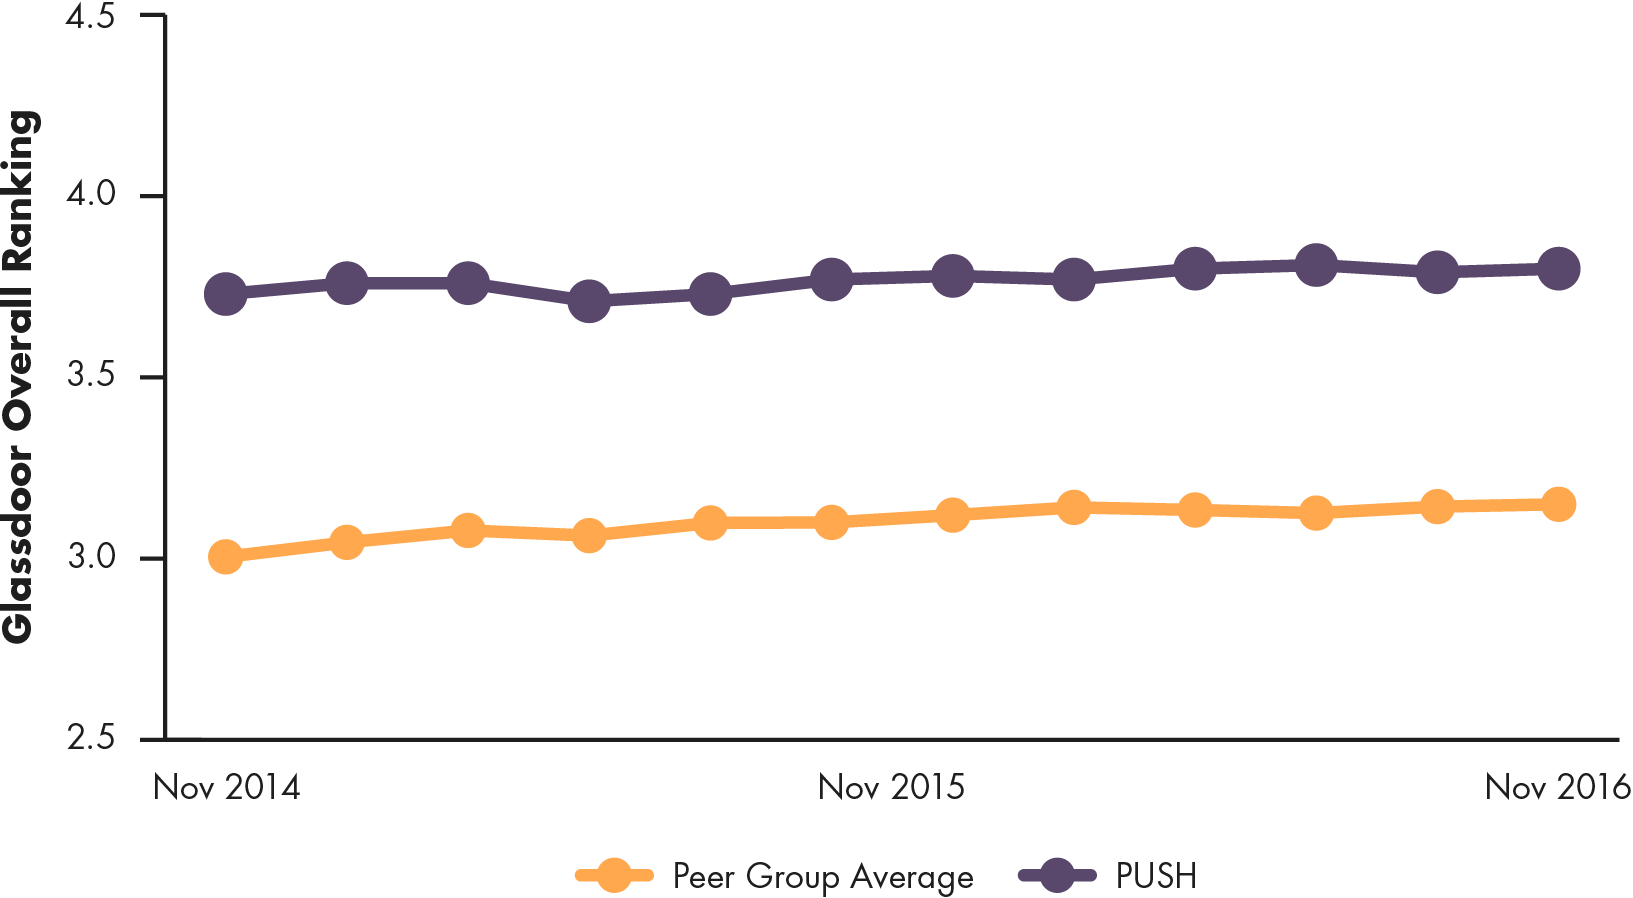
Publix’s Employee Score |
||
|---|---|---|
| Employee Score: 9.1Employee Rank: #2 | ||
| The Good Jobs Employee component is a composite of Glassdoor and Indeed scores (see Methodology for more details). Glassdoor provides a 2-year trailing score trend, republished here with the peer group average for comparison. |
Publix Glassdoor Rating Trend |
|
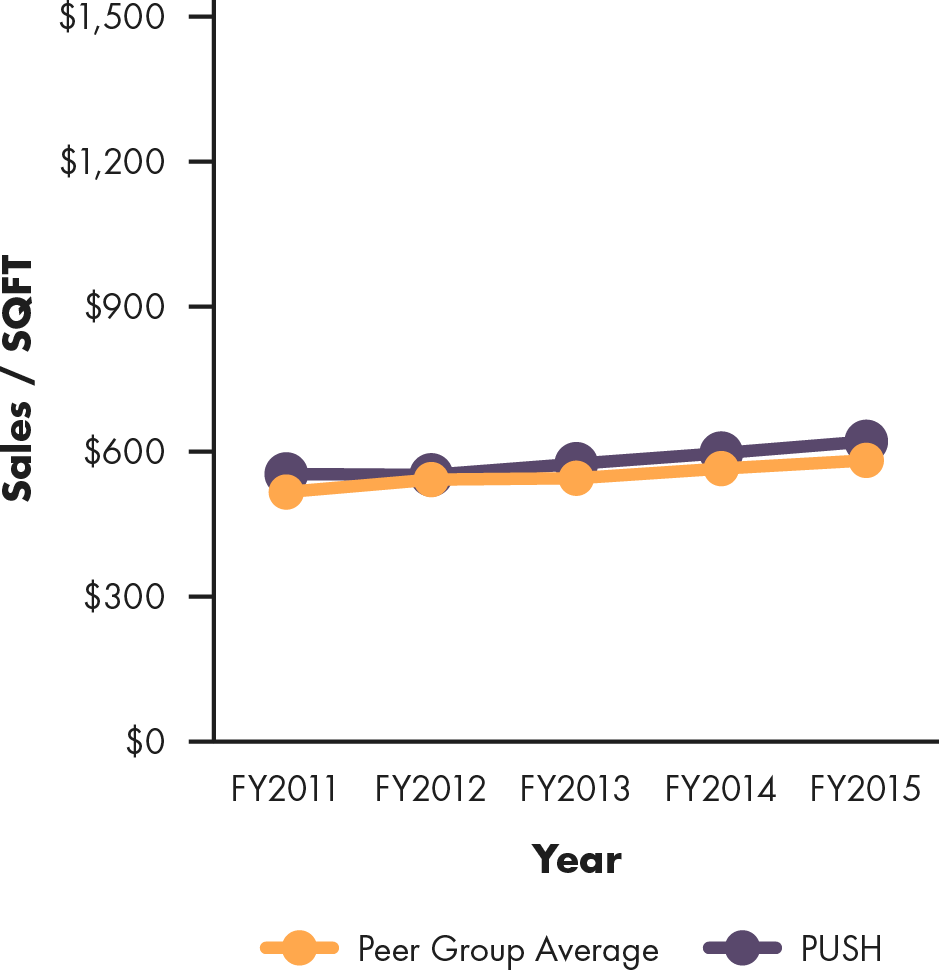
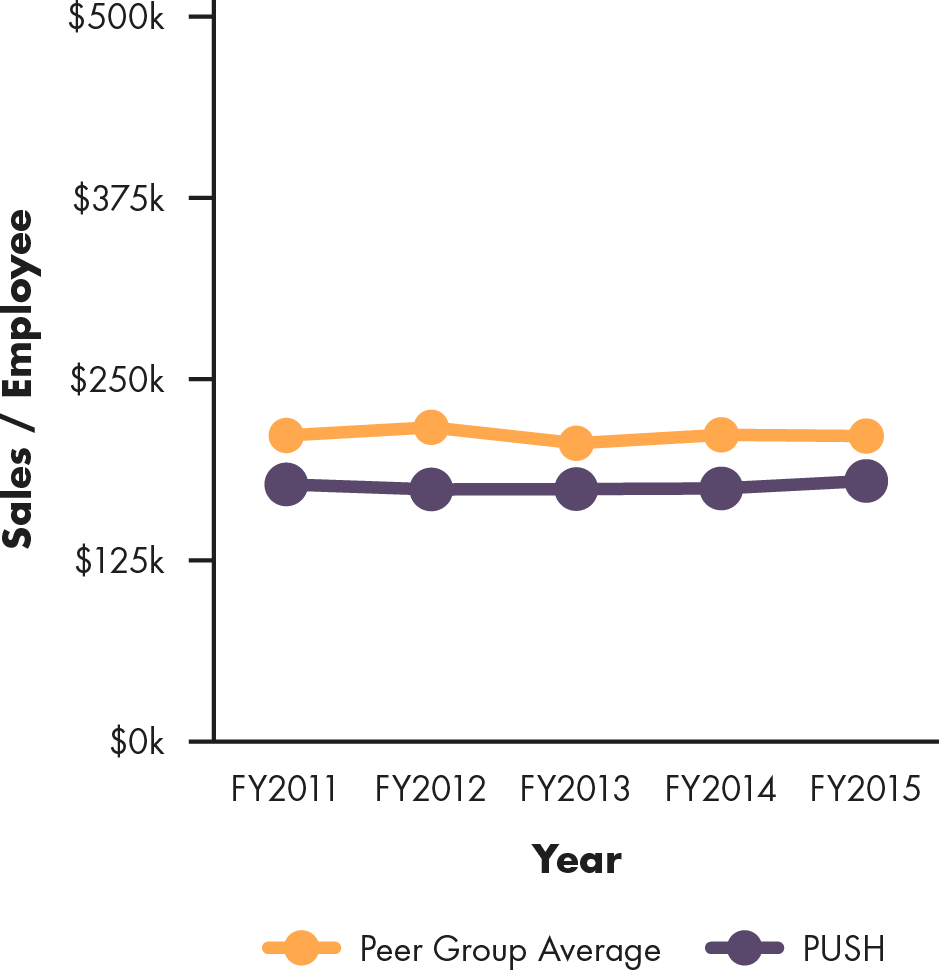
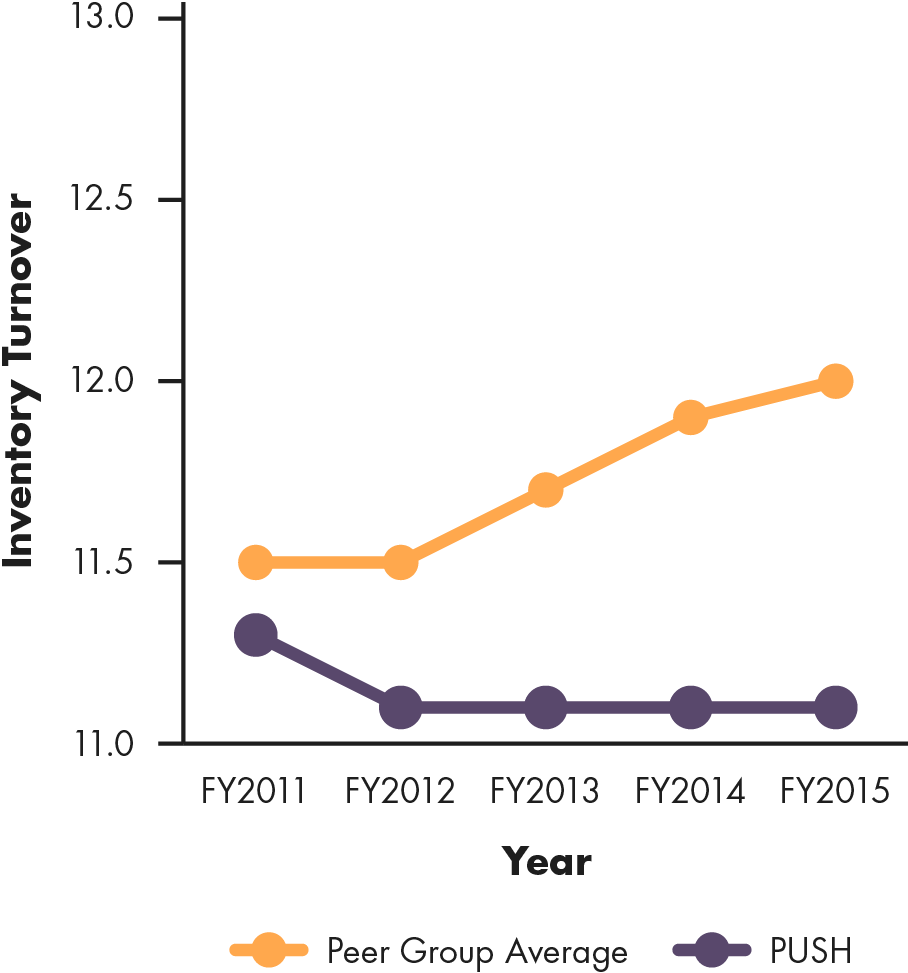
Publix’s Productivity Score |
||
|---|---|---|
| Productivity Score: 3.6Productivity Rank: #7 | ||
|
Sales/SQFT
|
Sales/Employee
|
Inventory Turnover
|
Whole Foods (NASDAQ:WFM)
Whole Foods is a publicly traded grocery store chain, with 2015 revenues of $15.3 billion across 431 stores and 90,900. Each Whole Foods carries an average of 32,000 SKUs, with an assortment of grocery items including fresh produce, flowers and gifts, pharmacy items, and health and beauty products. Their stated mission is a series of core values: (1) to sell the highest quality natural and organic products available; to satisfy, delight and nourish customers; (2) to support Team Member happiness and excellence; (3) to create wealth through profits and growth; to serve and support local and global communities; (4) to practice and advance environmental stewardship; (5) to create ongoing win-win partnerships with suppliers; and (6) to promote the health of stakeholders through healthy eating education.
Whole Foods’ Good Jobs Score Overview |
||
|---|---|---|
| Overall Score: 6.5Overall Rank: #3 | ||
|
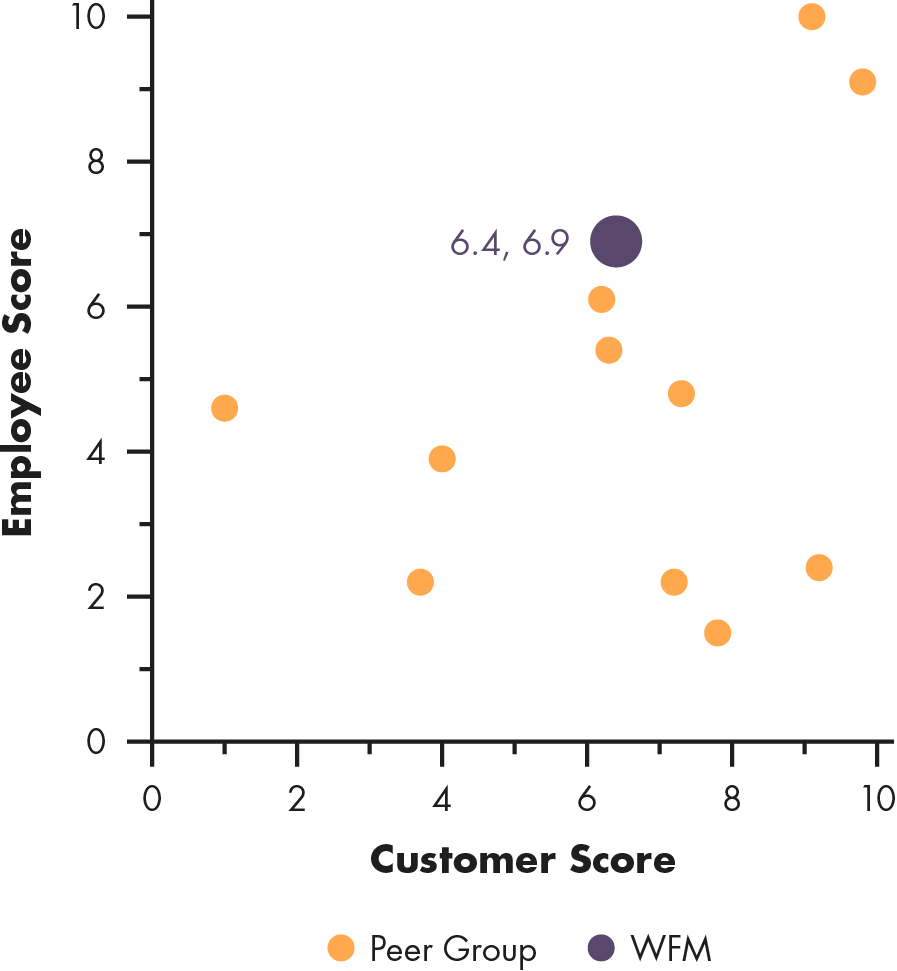
Customer/Employee Scores
|
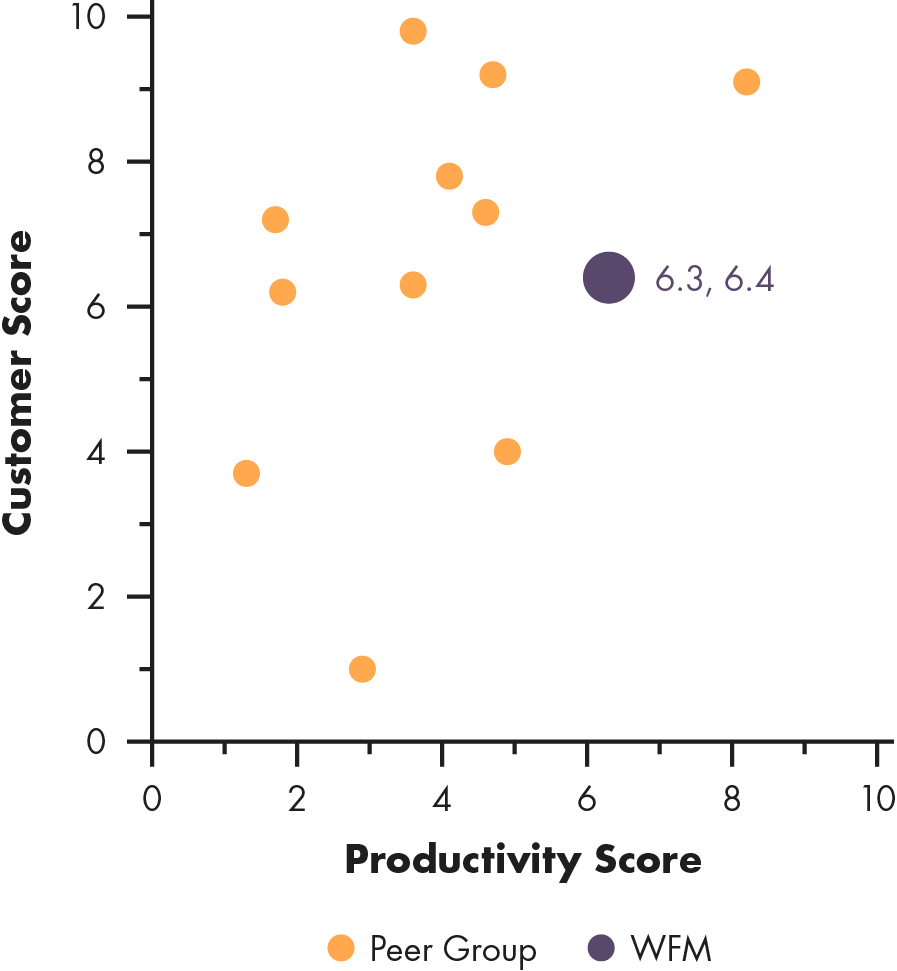
Productivity/Customer Scores
|
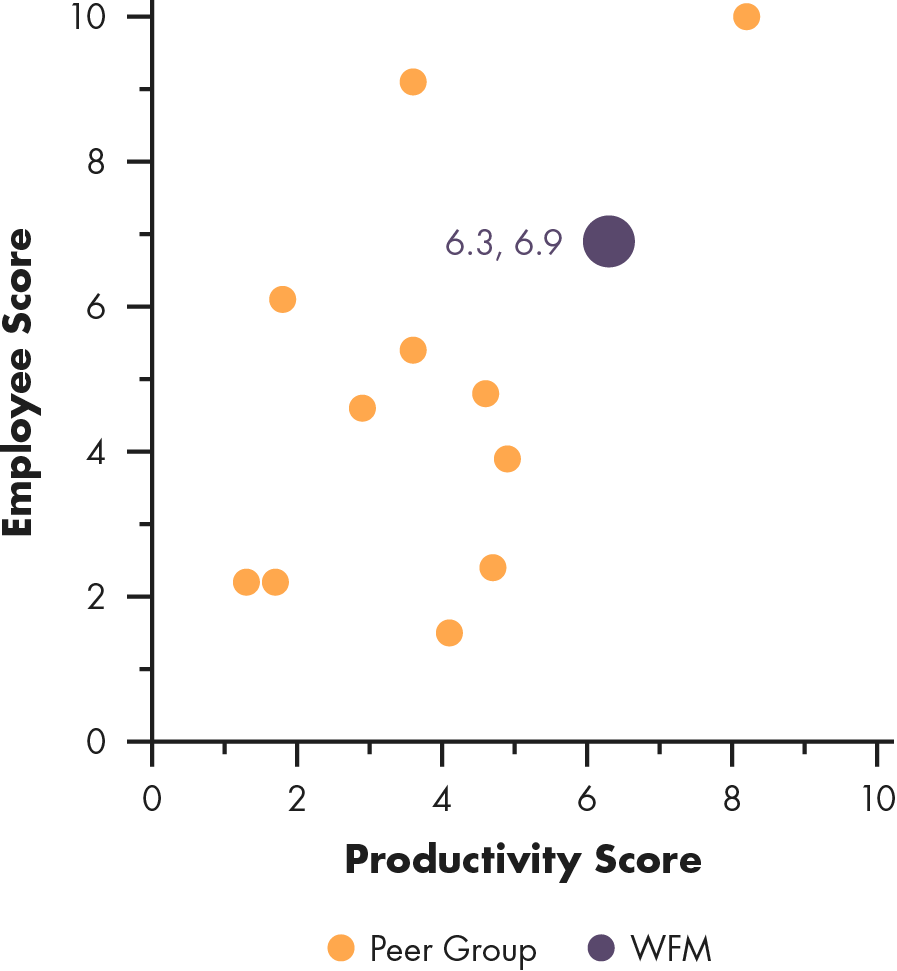
Productivity/Employee Scores
|
Whole Foods’ Customer Score |
||
|---|---|---|
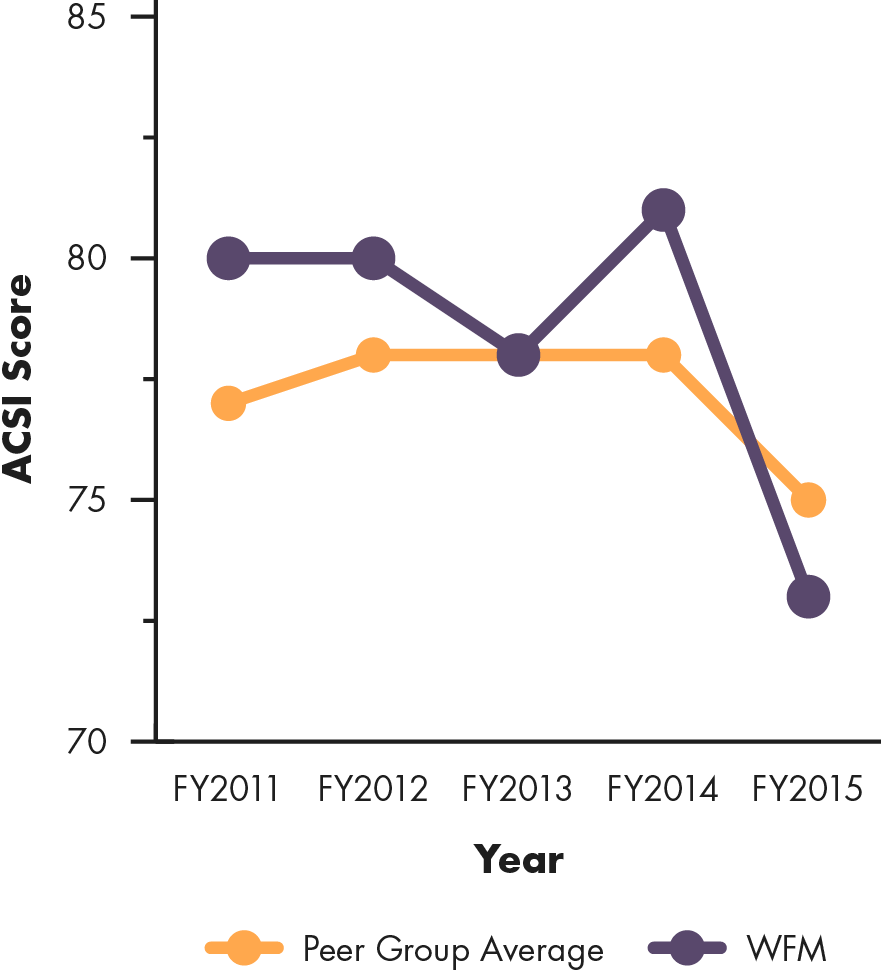
| Customer Score: 6.4Customer Rank: #7 | ||
| For 2016, the Good Jobs Customer component is composed of ASCI and Yelp scores. The 2015 score include Consumer Reports data, unavailable this year due it the biennial schedule of the report. Some companies only have two years of ACSI trend data – these companies are not tracked by the index; their scores are generated by predicting what their scores would have been using their relationship to Yelp data. |
ACSI Trend |
|
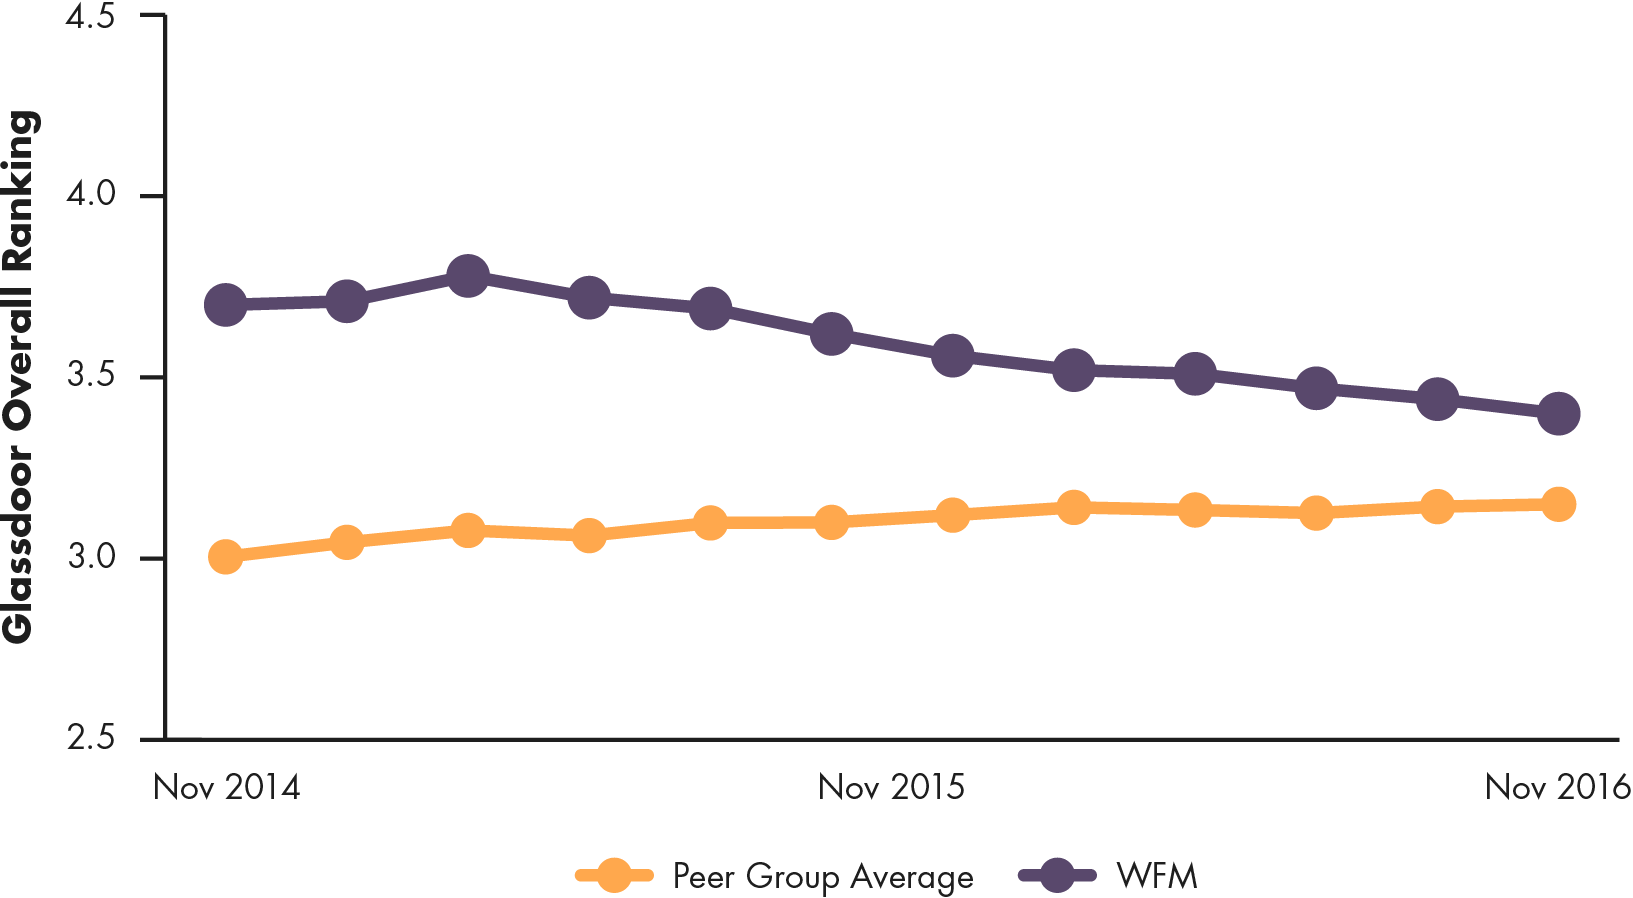
Whole Foods’ Employee Score |
||
|---|---|---|
| Employee Score: 6.9Employee Rank: #3 | ||
| The Good Jobs Employee component is a composite of Glassdoor and Indeed scores (see Methodology for more details). Glassdoor provides a 2-year trailing score trend, republished here with the peer group average for comparison. |
Whole Foods Glassdoor Rating Trend |
|
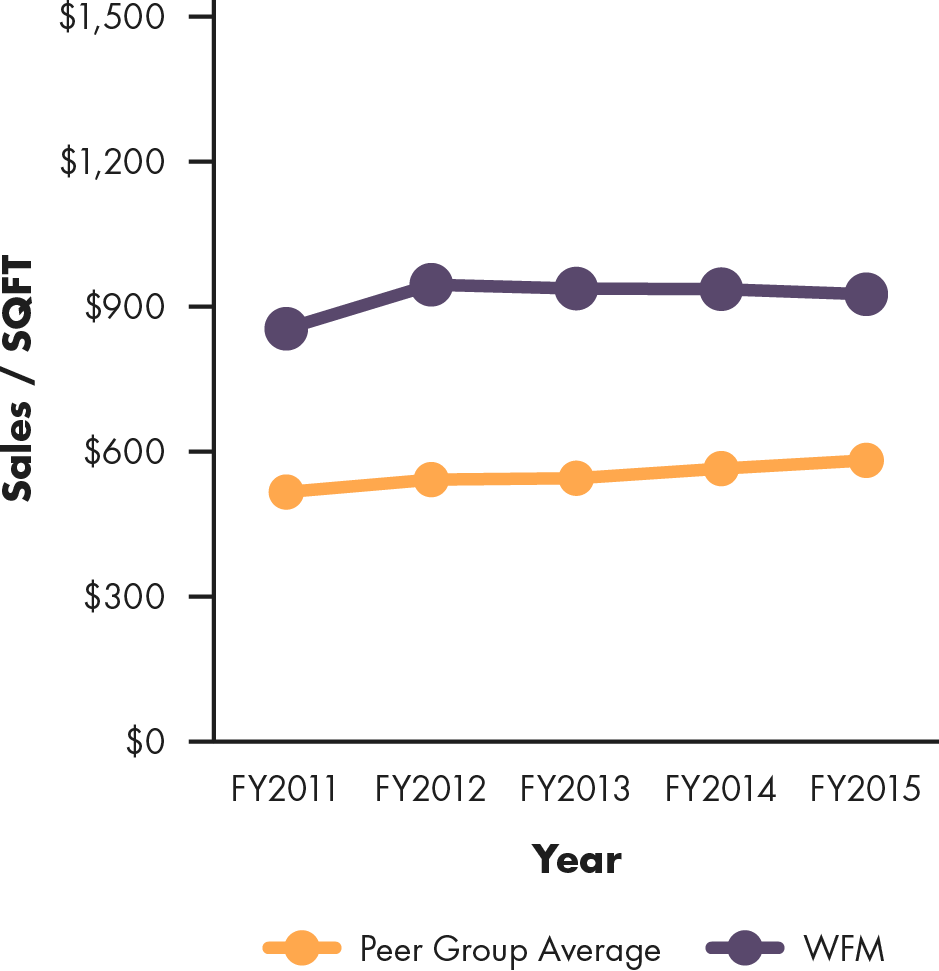
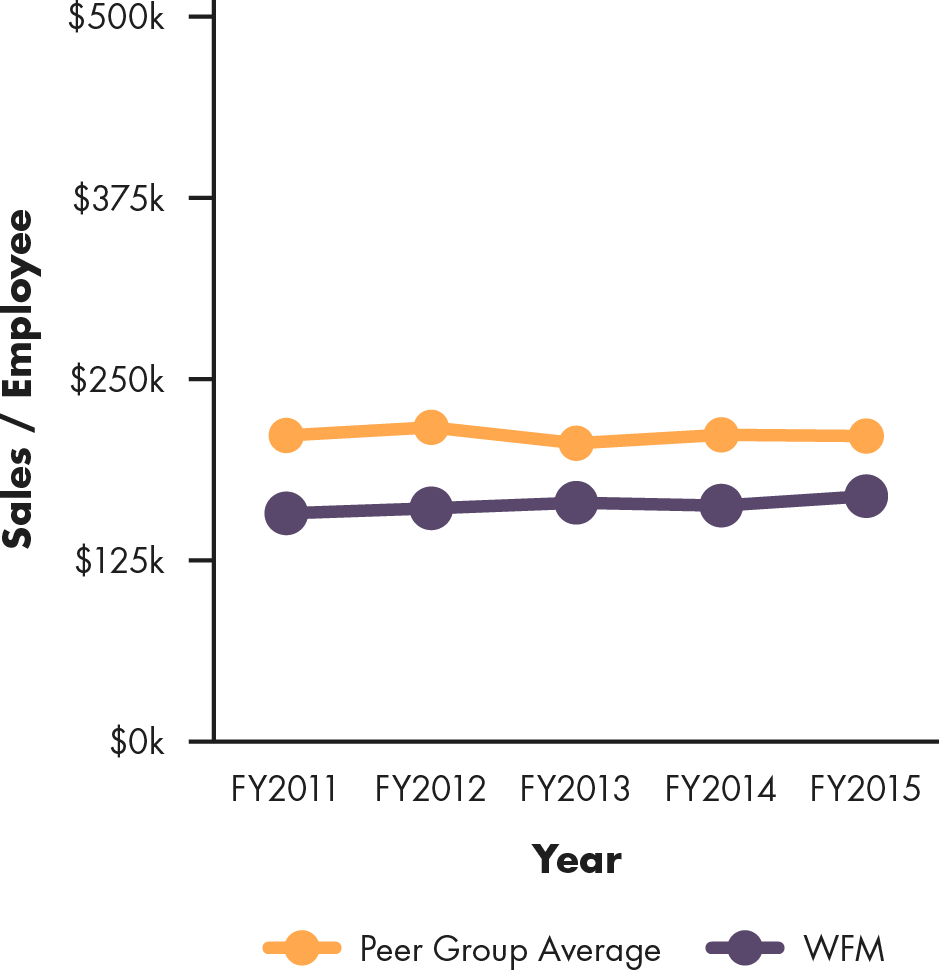
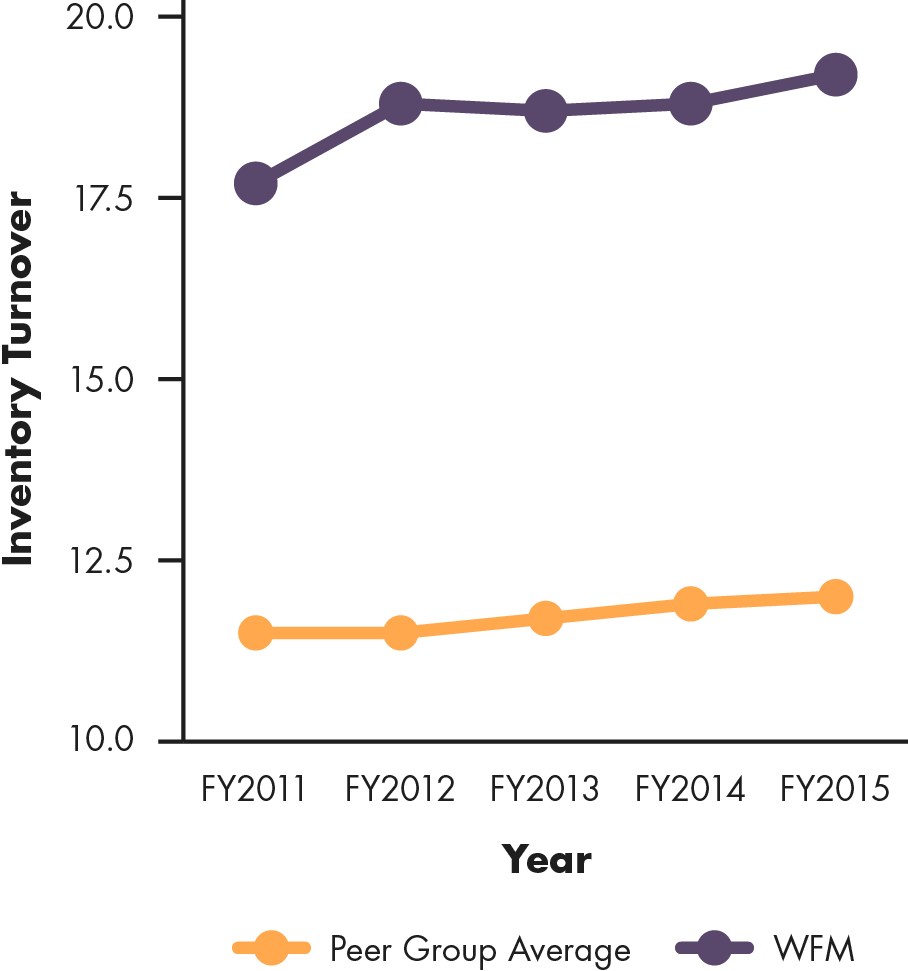
Whole Foods’ Productivity Score |
||
|---|---|---|
| Productivity Score: 6.3Productivity Rank: #2 | ||
|
Sales/SQFT
|
Sales/Employee
|
Inventory Turnover
|
Kroger (NYSE:KR)
Kroger is a massive grocery store chain. It closed its acquisition of Roundy’s in December 2015, extending its reach into new markets, particularly in the US Midwest. Kroger operates more than 2,700 stores in four categories: more than 2000 of these are combo stores, carrying a combination of food and drug items, followed by smaller numbers of marketplace stores, carrying full-service grocery, pharmacy and expanded general merchandise including outdoor living products, electronics, home goods and toys; multi-department stores, carrying more than 225,000 food, apparel, and general merchandise products; and price-impact warehouse stores, carrying distinctive ethnic products, catering to the demographics of the neighborhoods that they serve at low prices in a warehouse format. These stores are operated across two-dozen banners.
2015 revenue was just under $110 billion, earned by 431,000 employees. Kroger does not report their average number of SKUs, but they carry a wide assortment of items including groceries, fresh produce, flowers and gifts, pharmacy items, and financial services (e.g., check cashing, bill payment, no contract wireless cell phone plans). Their stated mission is to improve customers’ shopping experiences through improved service, product quality and selection and price.
Kroger’s Good Jobs Score Overview |
||
|---|---|---|
| Overall Score: 5.5Overall Rank: #4 | ||
|
Customer/Employee Scores
|
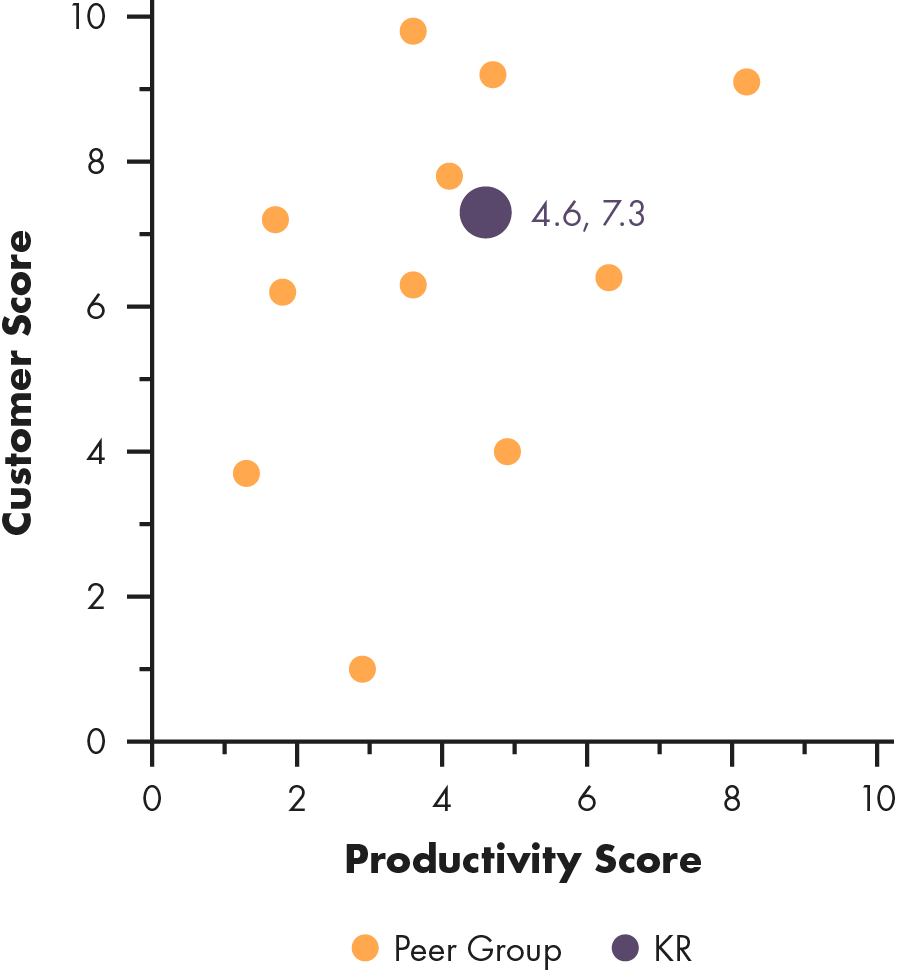
Productivity/Customer Scores
|
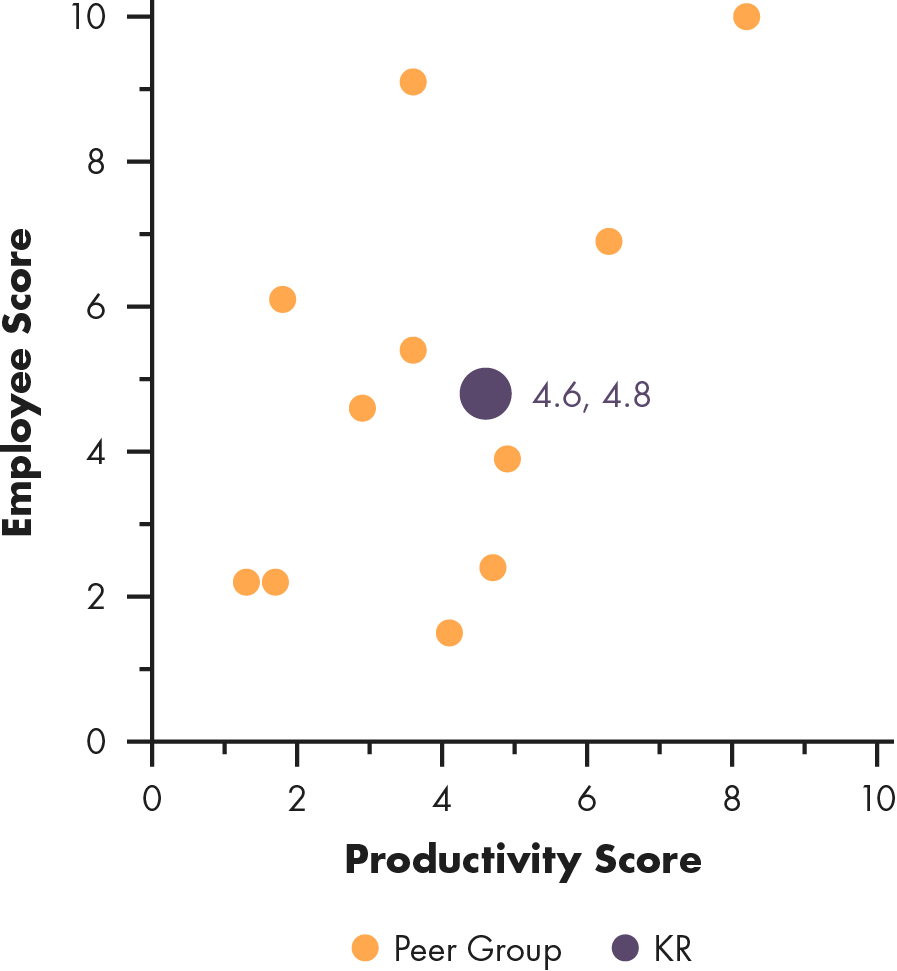
Productivity/Employee Scores
|
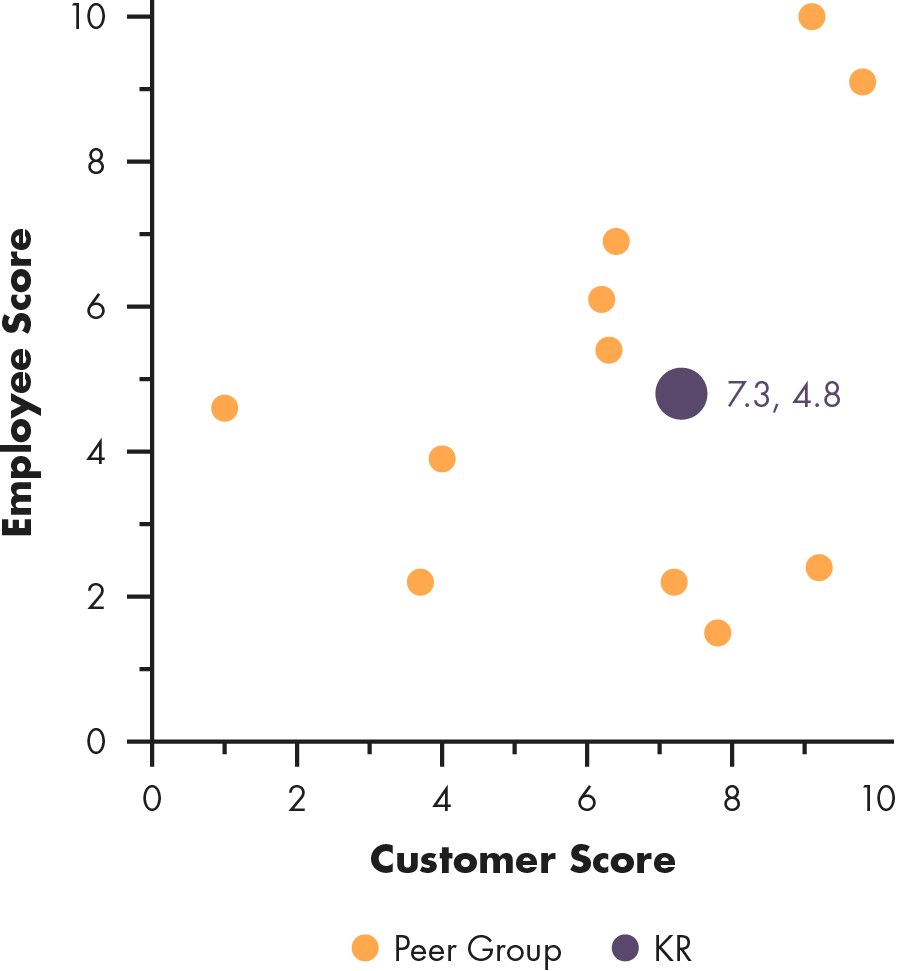
Kroger’s Customer Score |
||
|---|---|---|
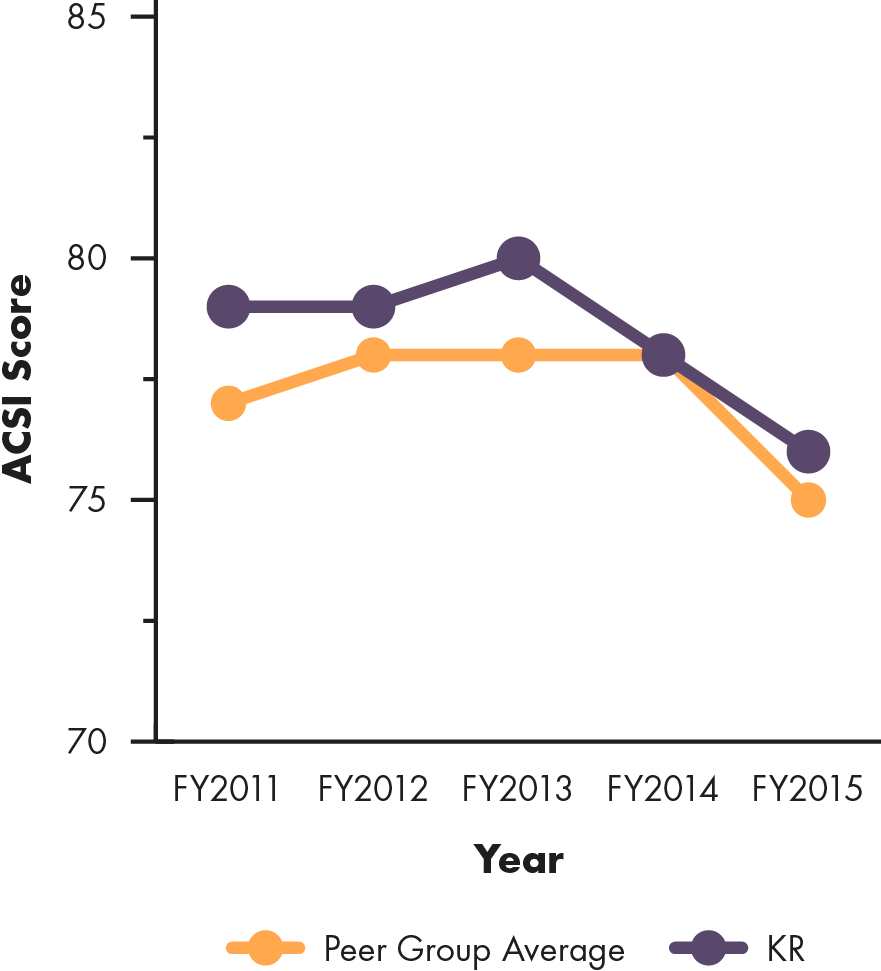
| Customer Score: 7.3Customer Rank: #5 | ||
| For 2016, the Good Jobs Customer component is composed of ASCI and Yelp scores. The 2015 score include Consumer Reports data, unavailable this year due it the biennial schedule of the report. Some companies only have two years of ACSI trend data – these companies are not tracked by the index; their scores are generated by predicting what their scores would have been using their relationship to Yelp data. |
ACSI Trend |
|
Kroger’s Employee Score |
||
|---|---|---|
| Employee Score: 4.8Employee Rank: #6 | ||
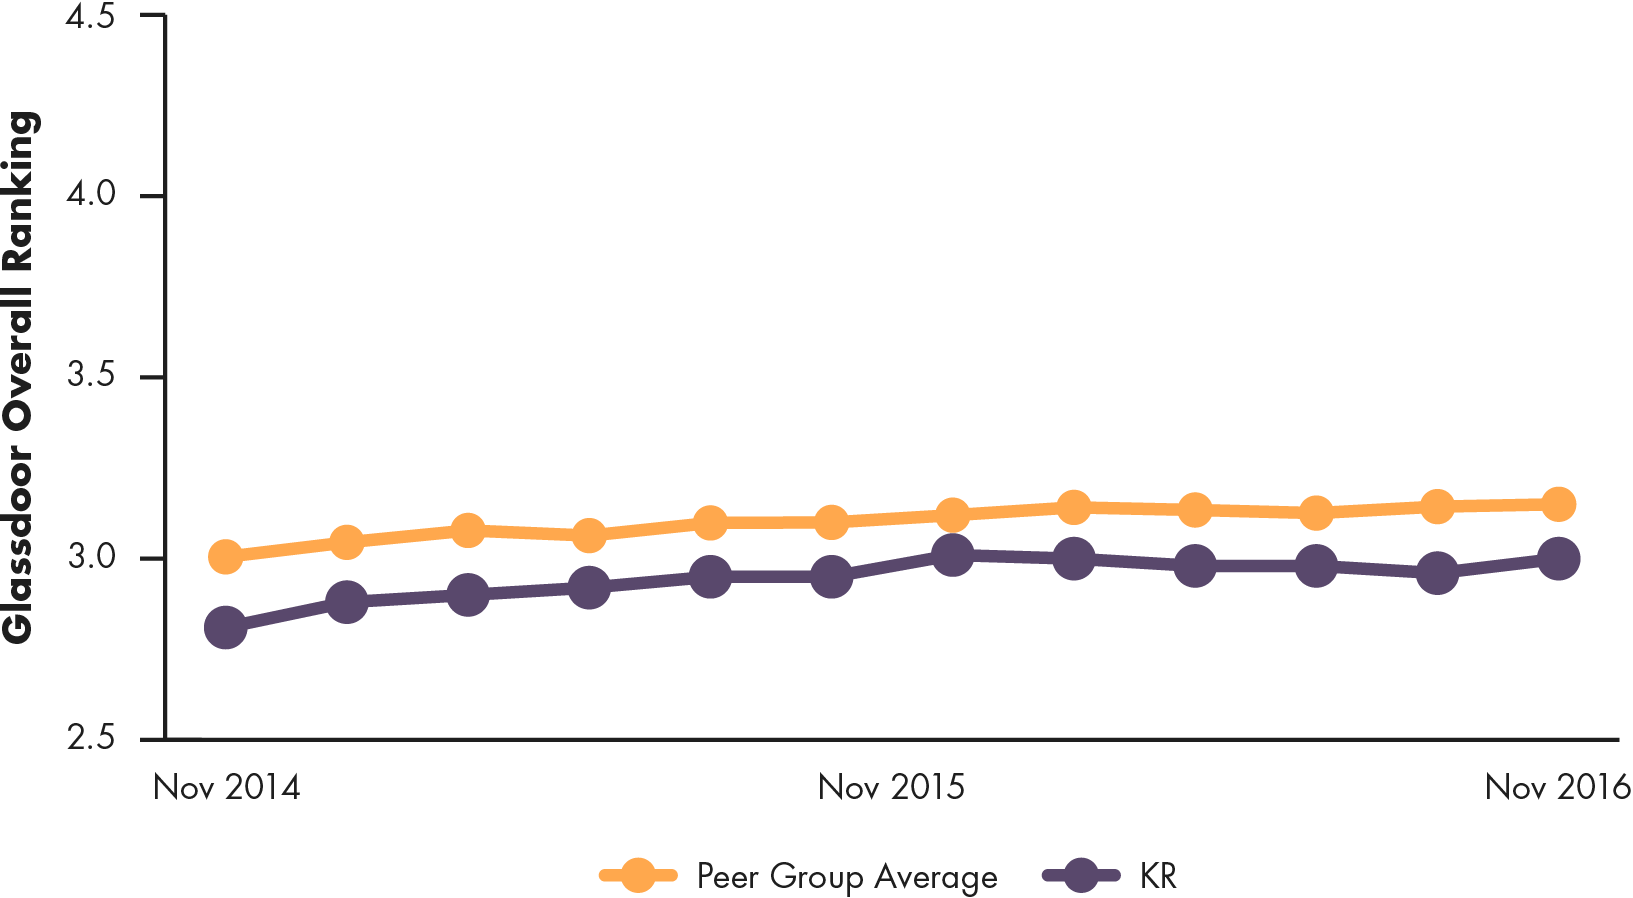
| The Good Jobs Employee component is a composite of Glassdoor and Indeed scores (see Methodology for more details). Glassdoor provides a 2-year trailing score trend, republished here with the peer group average for comparison. |
Kroger’s Glassdoor Rating Trend |
|
Kroger’s Productivity Score |
||
|---|---|---|
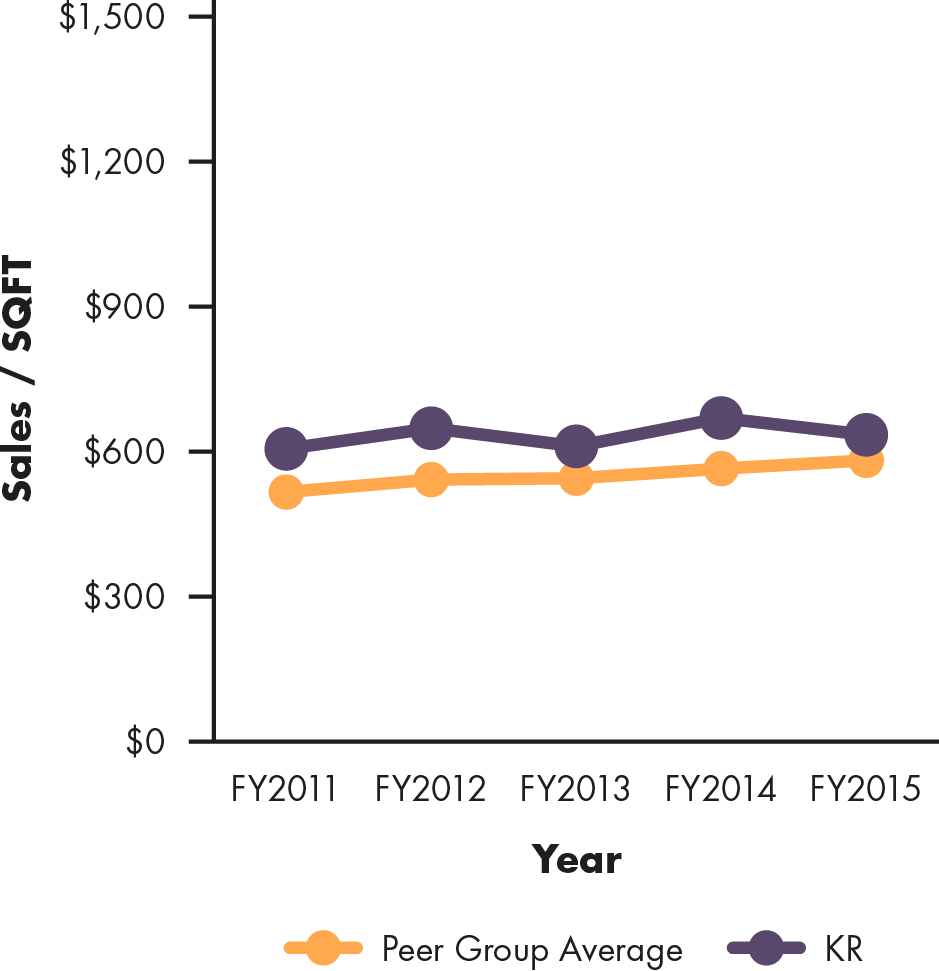
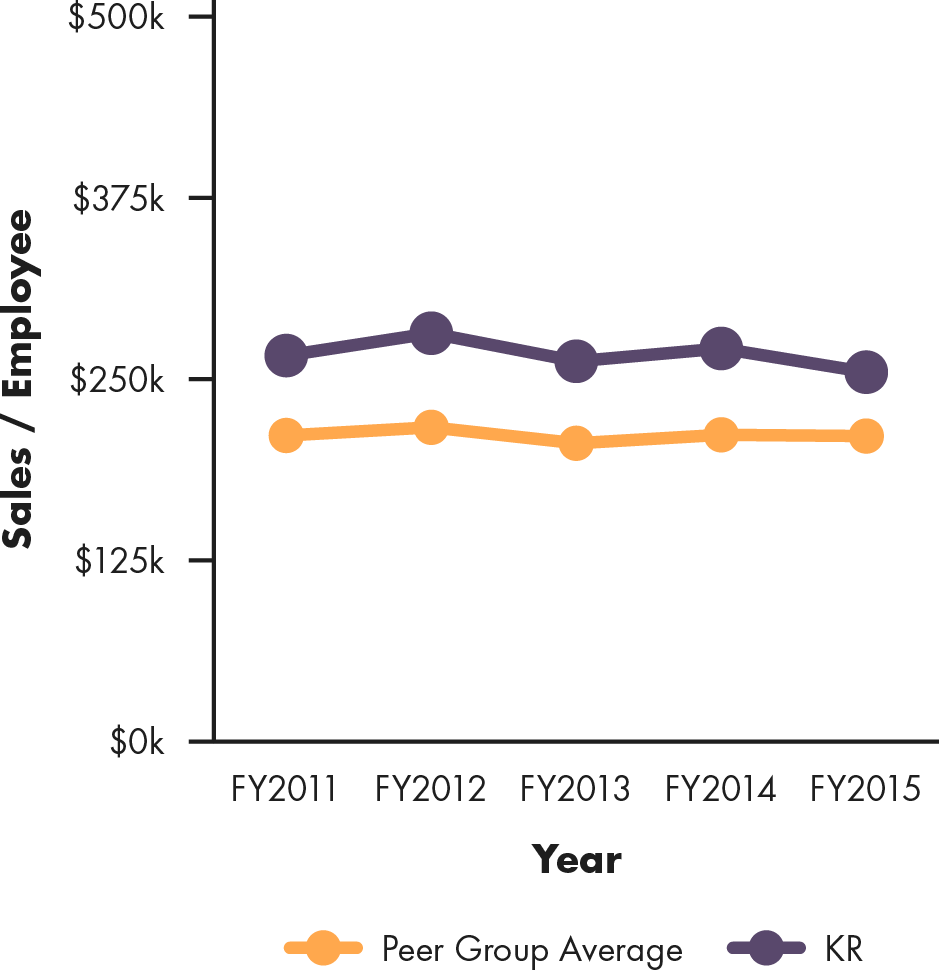
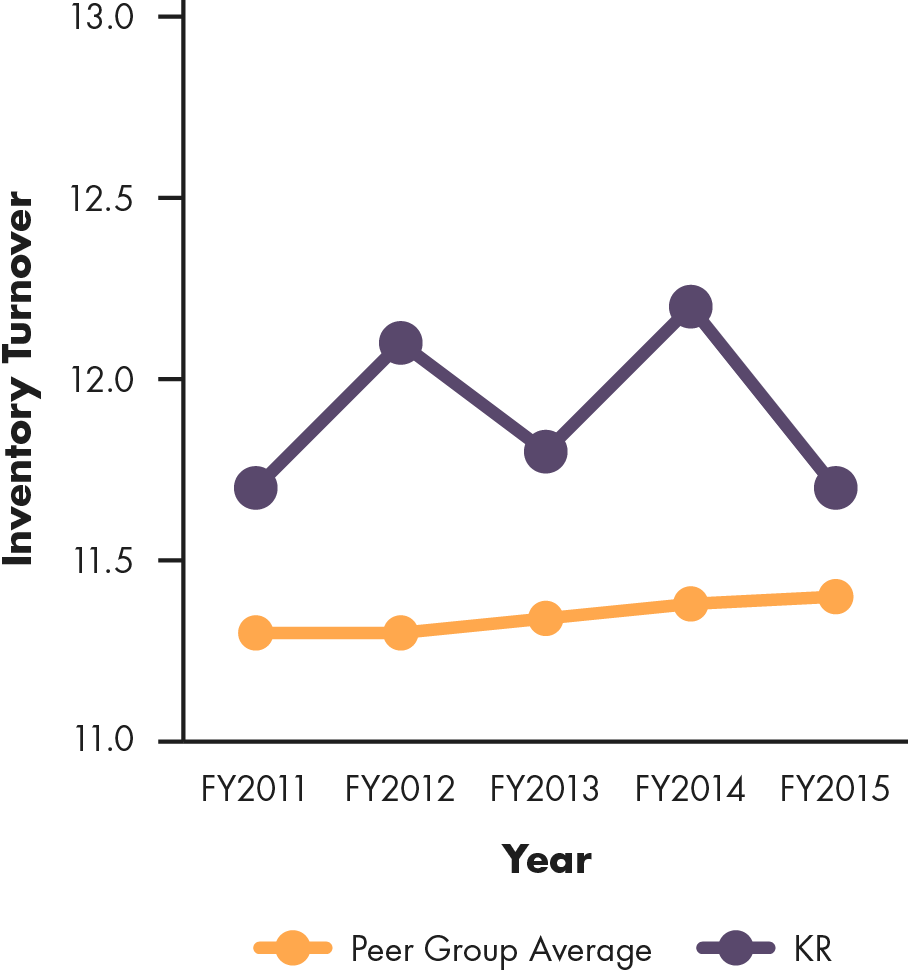
| Productivity Score: 4.6Productivity Rank: #5 | ||
|
Sales/SQFT
|
Sales/Employee
|
Inventory Turnover
|
Delhaize (NYSE:DEG)
The Delhaize Group operates companies in seven countries on three continents: North America, Europe and Asia, but this analysis focuses exclusively on their U.S. operations. In the U.S., Delhaize is publicly traded with 1,288 stores under two banners: Food Lion and Hannaford. In June 2015, Delhaize announced intentions to merge with Ahold, which will more than double revenues in the United States. Current US operations employ almost 99,000 people and account for 66% of the company’s revenue, which totaled almost $18 billion in 2015. Each Delhaize operated market carries an average of 35,500 SKUs, with an assortment of grocery items including fresh produce, flowers and gifts, and health and beauty products. Their stated purpose is to operate their customers’ preferred local supermarkets and work together to support that ambition.
Delhaize’s Good Jobs Score Overview |
||
|---|---|---|
| Overall Score: 5.0Overall Rank: #5 | ||
|
Customer/Employee Scores
|
Productivity/Customer Scores
|
Productivity/Employee Scores
|
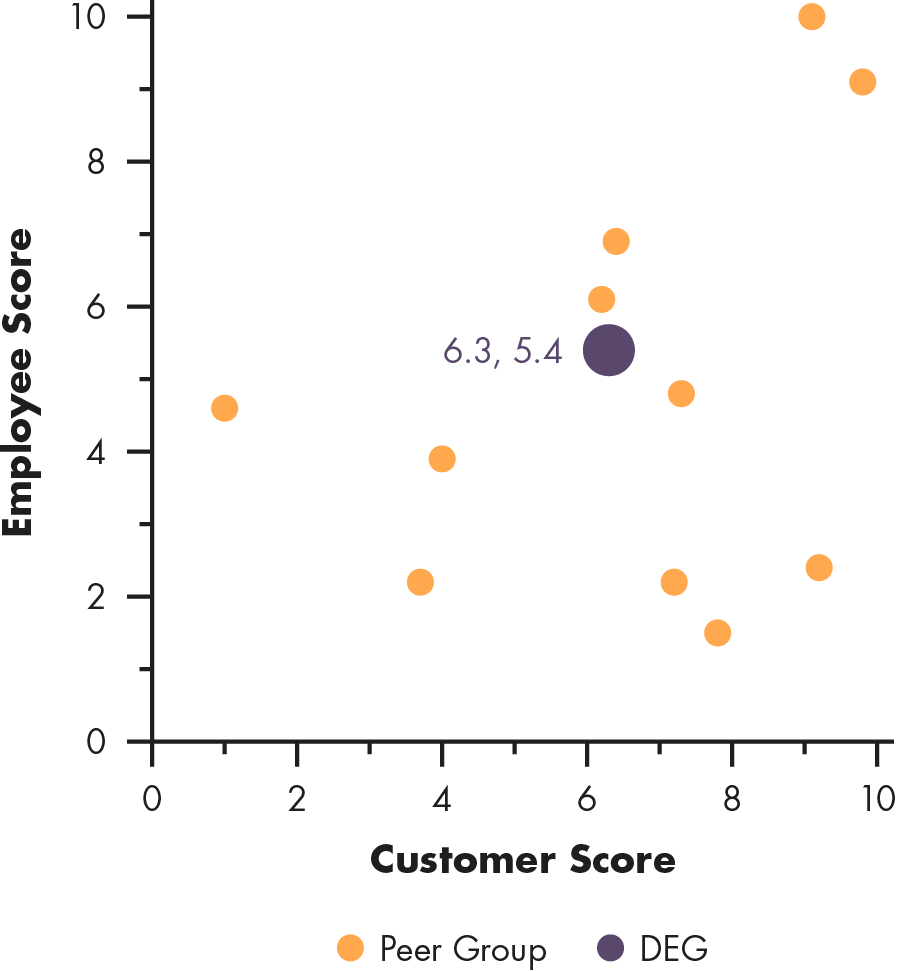
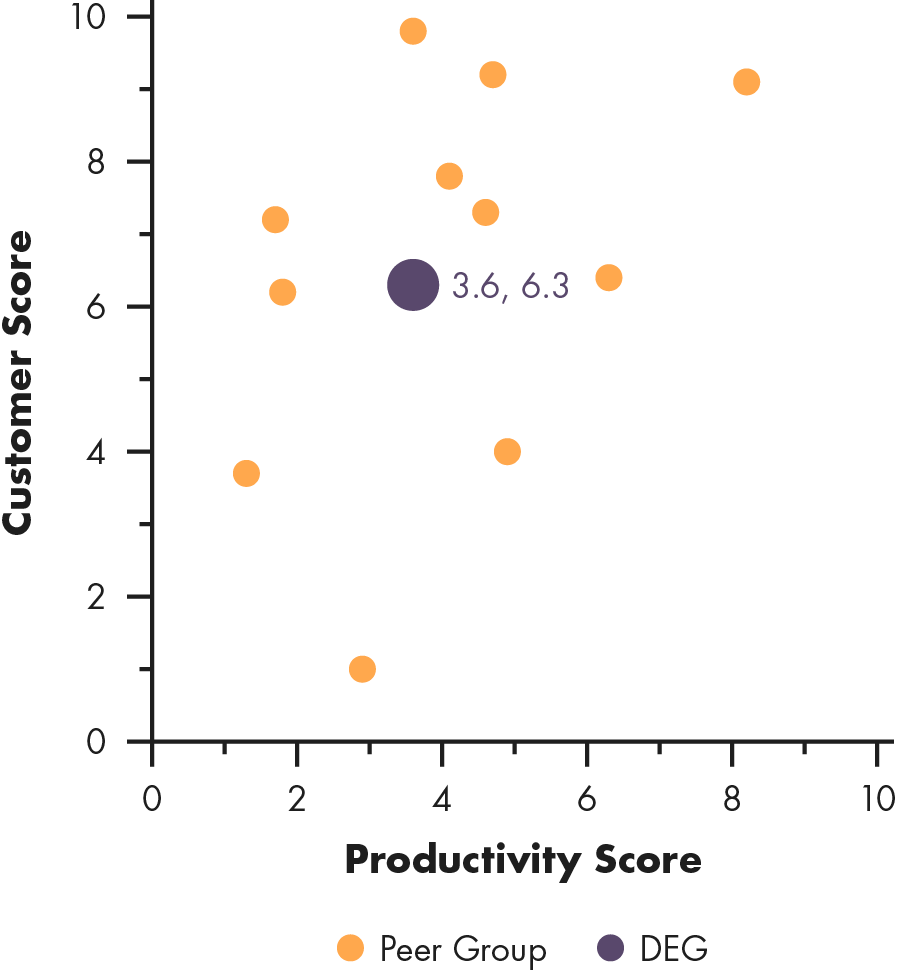
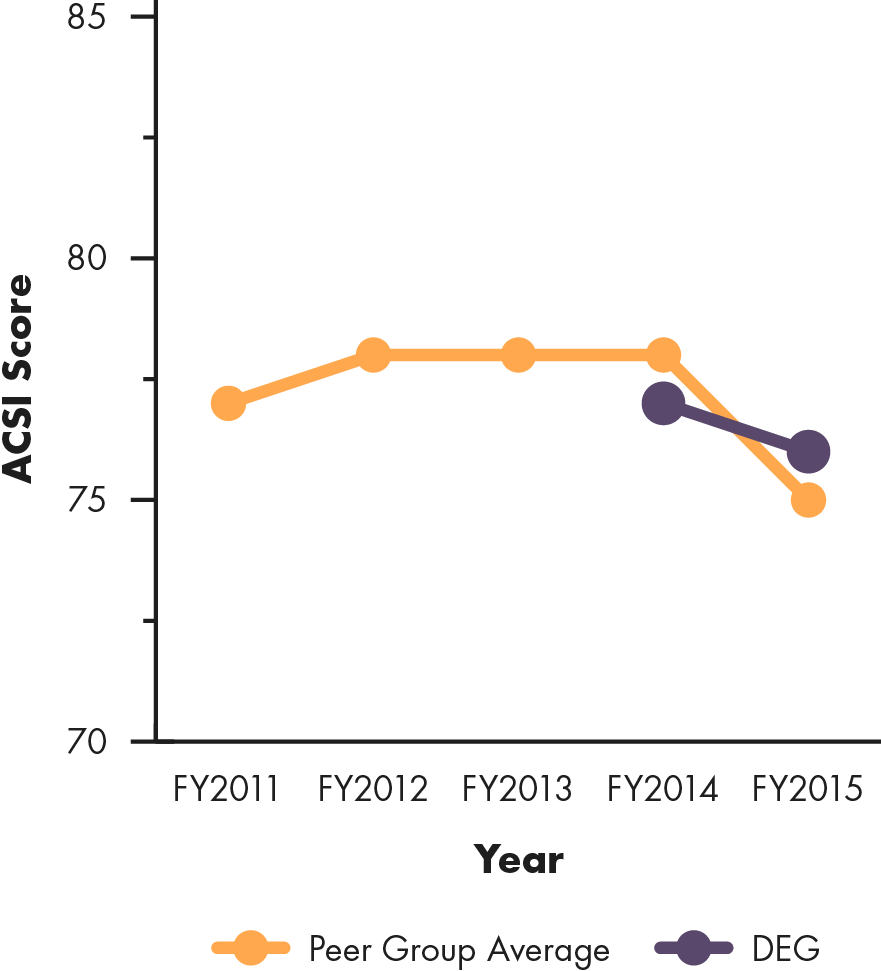
Delhaize’s Customer Score |
||
|---|---|---|
| Customer Score: 6.3Customer Rank: #8 | ||
| For 2016, the Good Jobs Customer component is composed of ASCI and Yelp scores. The 2015 score include Consumer Reports data, unavailable this year due it the biennial schedule of the report. Some companies only have two years of ACSI trend data – these companies are not tracked by the index; their scores are generated by predicting what their scores would have been using their relationship to Yelp data. |
ACSI Trend |
|
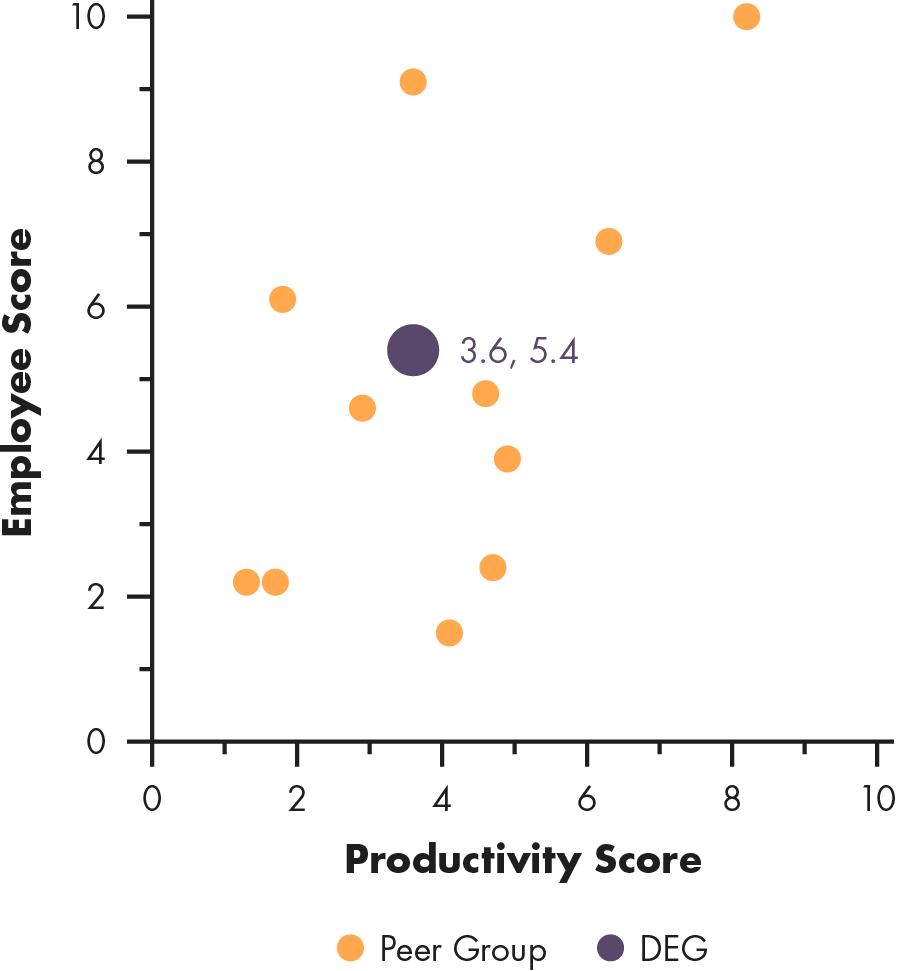
Delhaize’s Employee Score |
||
|---|---|---|
| Employee Score: 5.4Employee Rank: #5 | ||
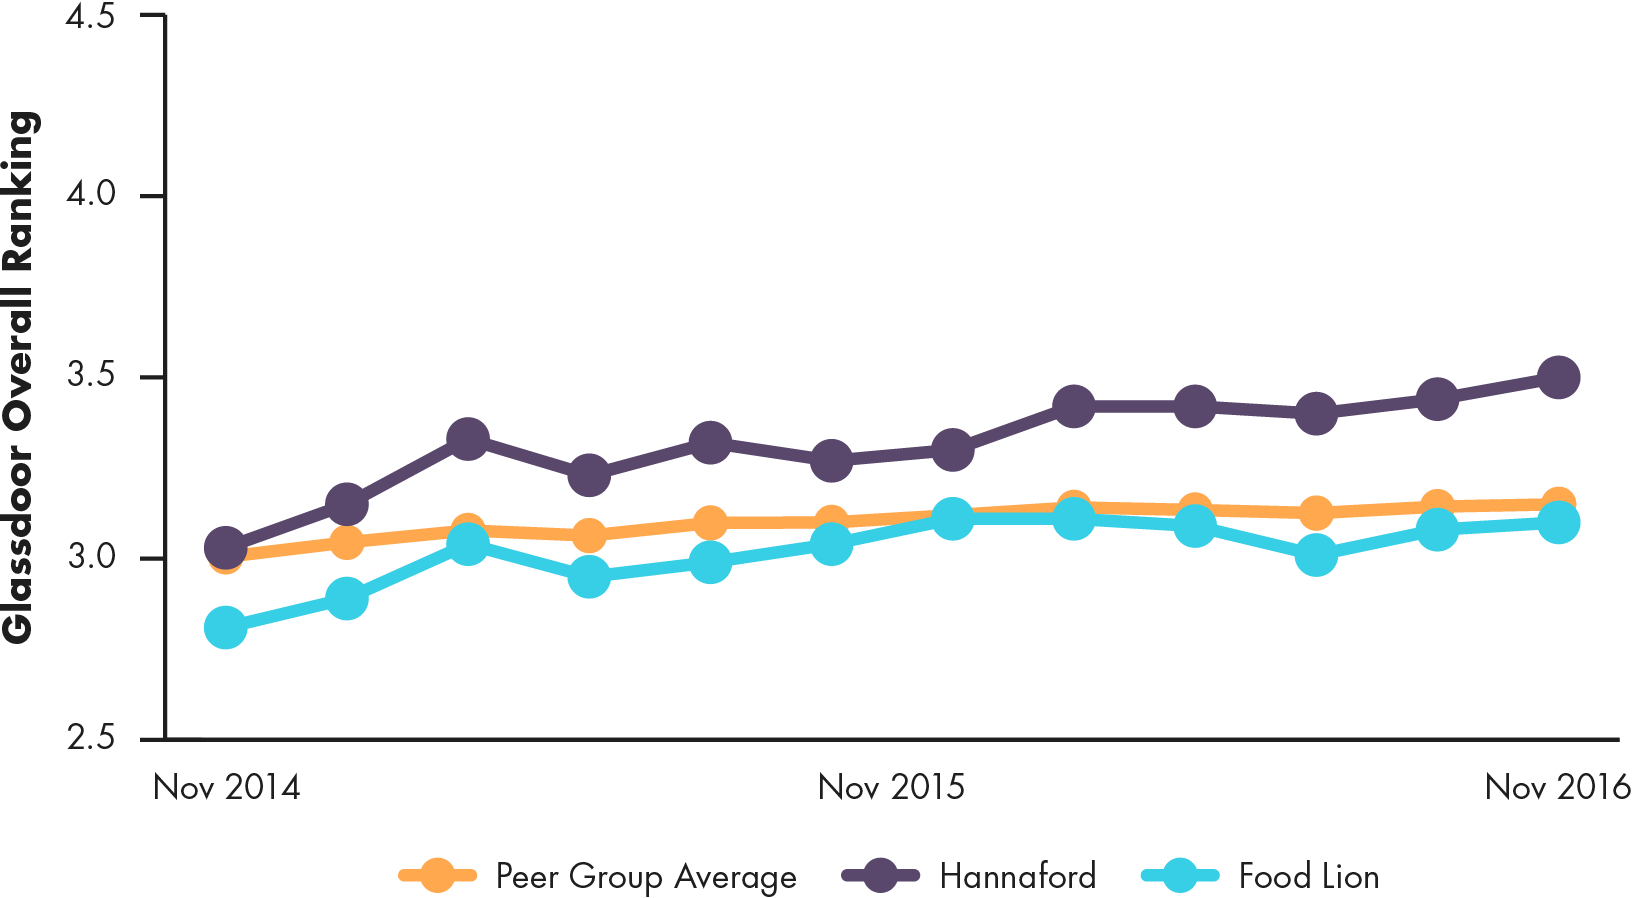
| The Good Jobs Employee component is a composite of Glassdoor and Indeed scores (see Methodology for more details). Glassdoor provides a 2-year trailing score trend, republished here with the peer group average for comparison. |
Kroger’s Glassdoor Rating Trend |
|
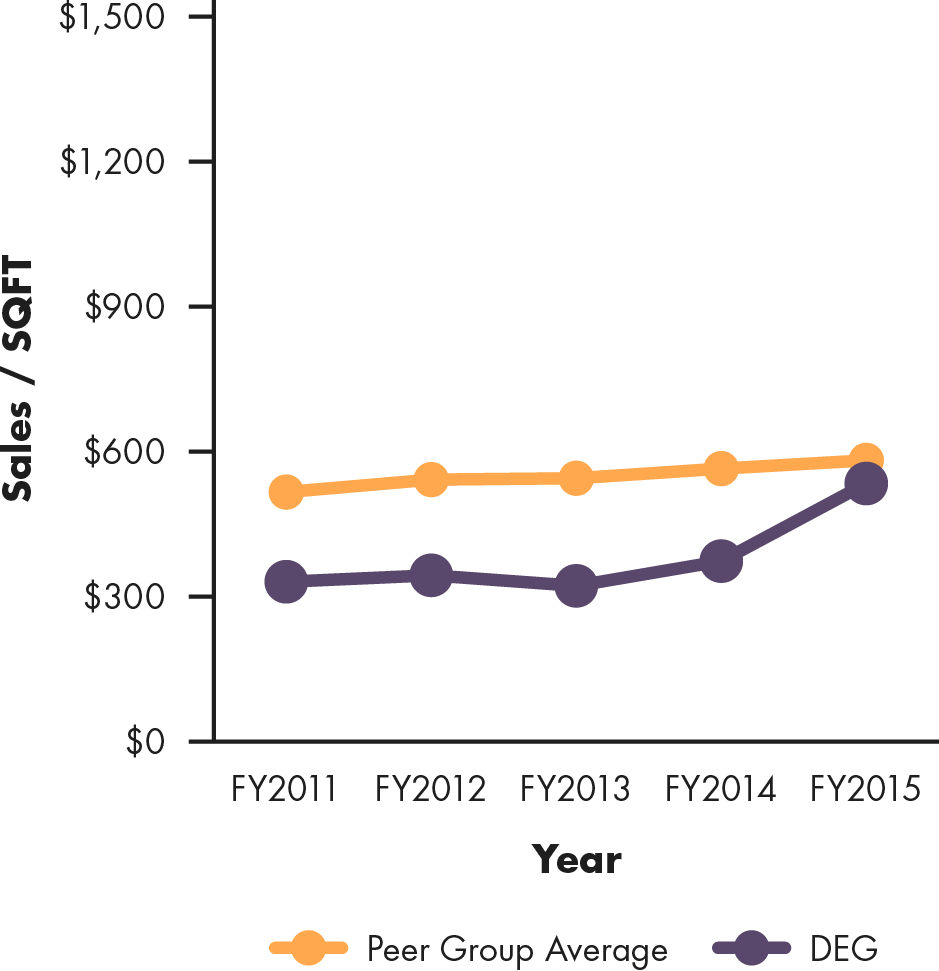
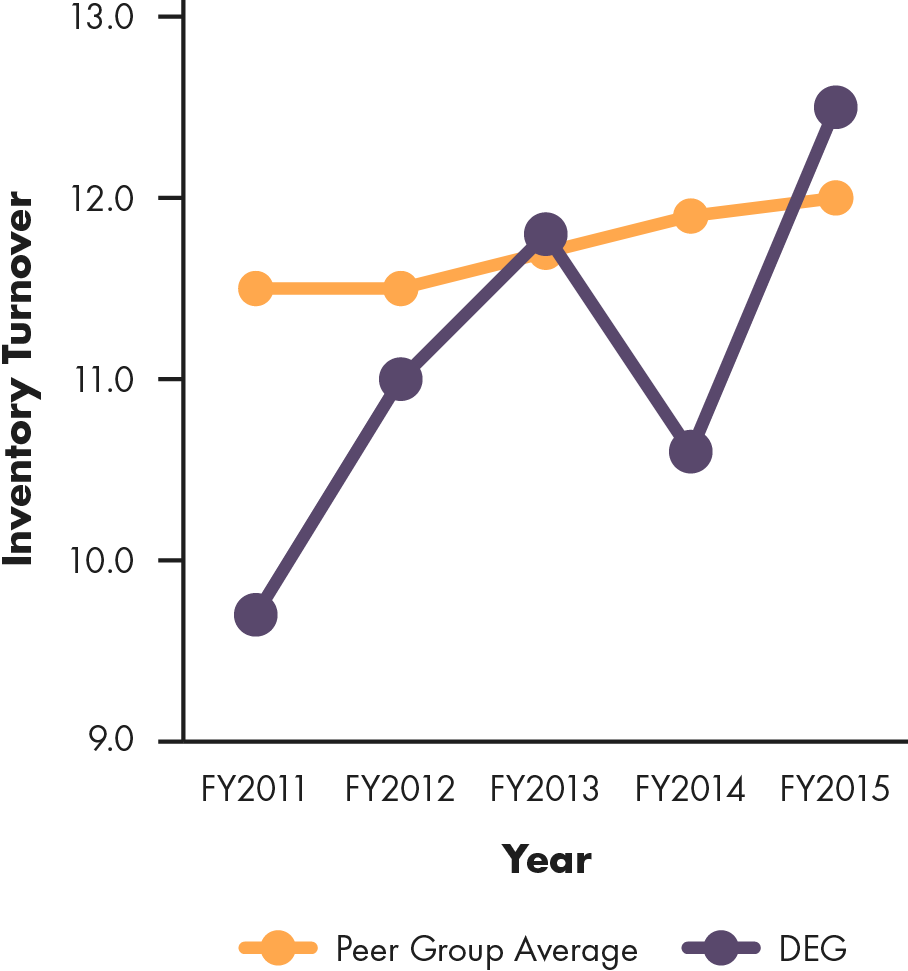
Delhaize’s Productivity Score |
||
|---|---|---|
| Productivity Score: 3.6Productivity Rank: #7 | ||
|
Sales/SQFT
|
Sales/Employee
|
Inventory Turnover
|
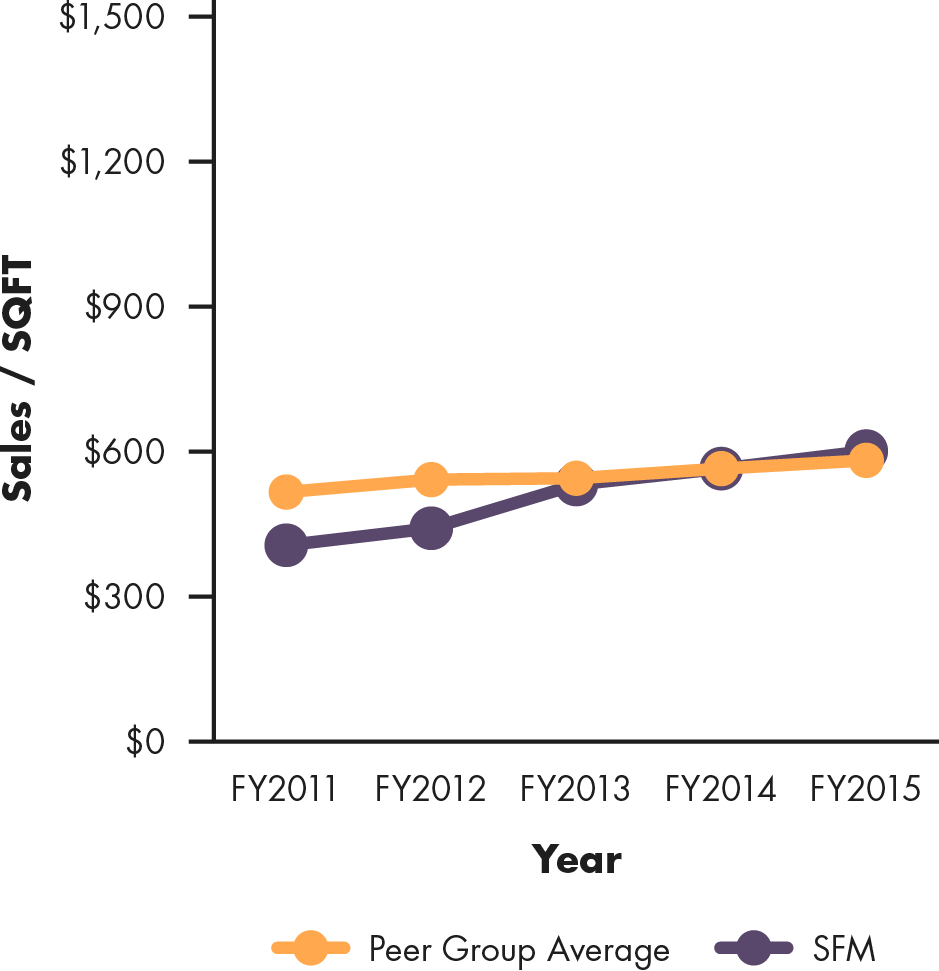
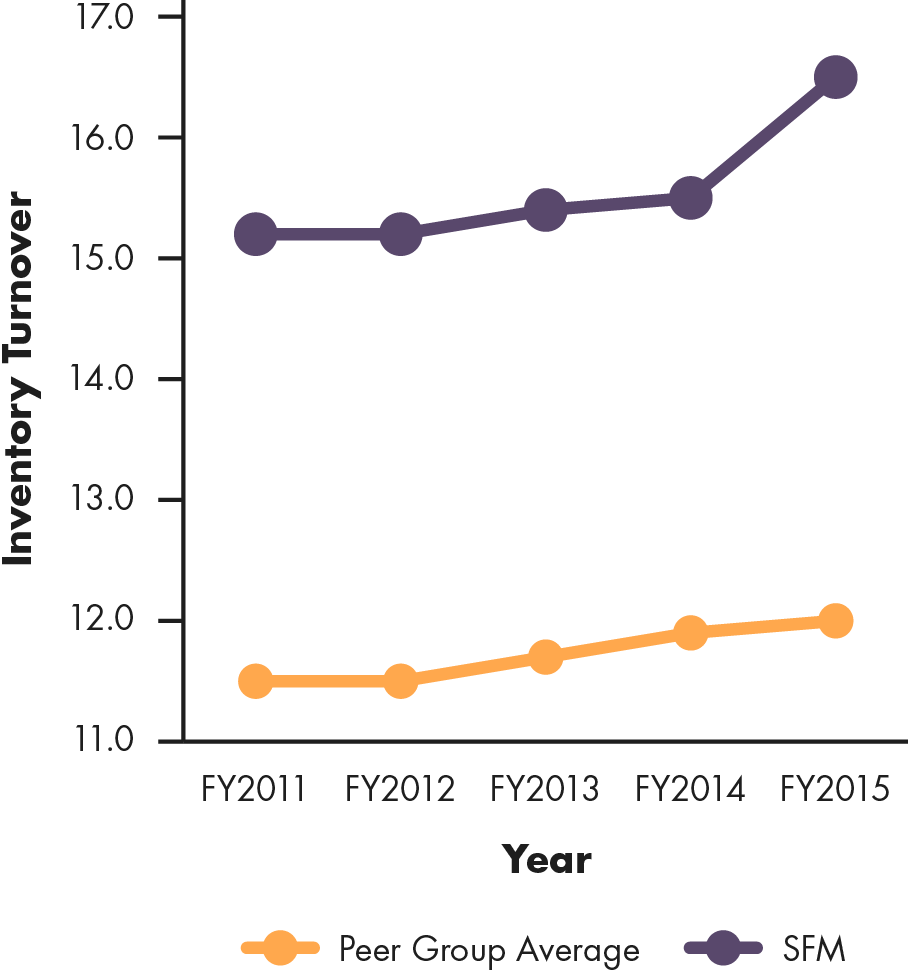
Sprouts Farmers Market (NASDAQ:SFM)
Sprouts Farmers Market is a publicly traded grocery store chain operating with 224 stores. The chain’s 2015 revenue totaled $3.6 billion and it employed approximately 20,000. Each Sprouts Farmers Market carries an average of 17,500 SKUs, with an assortment of grocery items including fresh produce, flowers and gifts, pharmacy items, and health and beauty products. Their mission states that the cornerstones of Sprouts’ business are fresh, natural and organic products at compelling prices (which they refer to as “Healthy Living for Less”), an attractive and differentiated shopping experience, and knowledgeable team members who they believe provide best-in-class customer service and product education. Sprouts capitalizes on two powerful, long-term consumer trends—a growing interest in health and wellness and a focus on value.
Sprouts Farmers Market’s Good Jobs Score Overview |
||
|---|---|---|
| Overall Score: 4.7Overall Rank: #6 | ||
|
Customer/Employee Scores
|
Productivity/Customer Scores
|
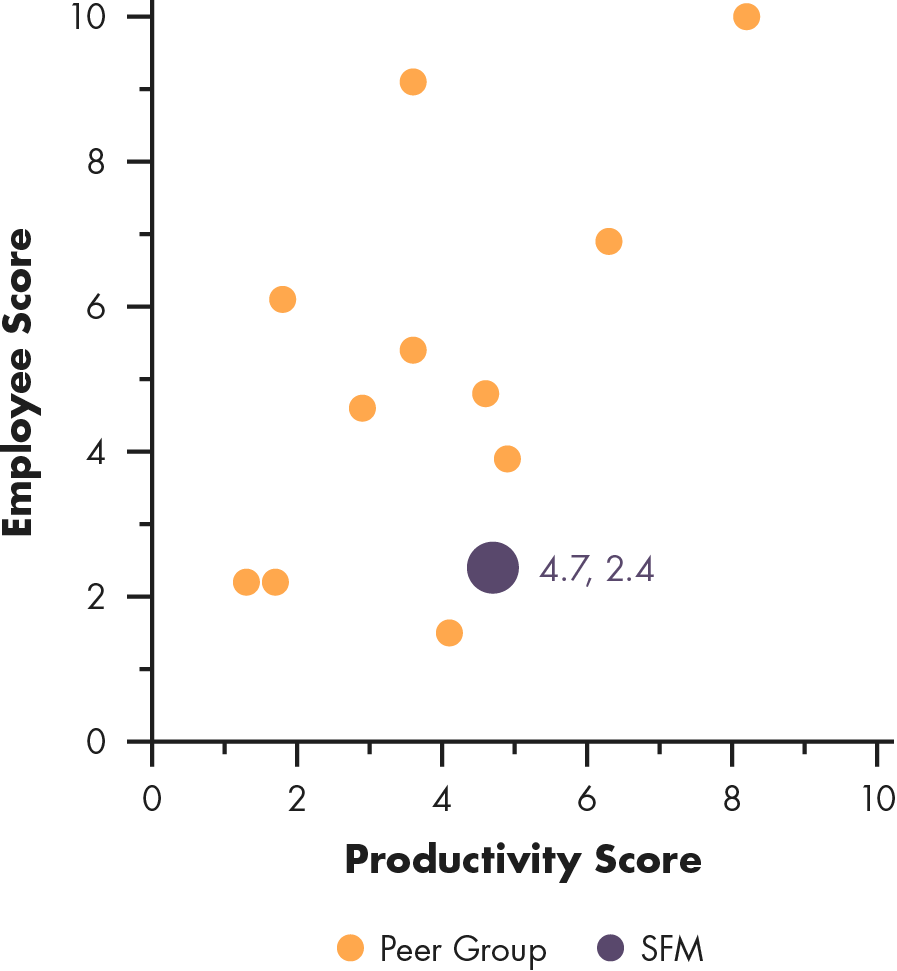
Productivity/Employee Scores
|
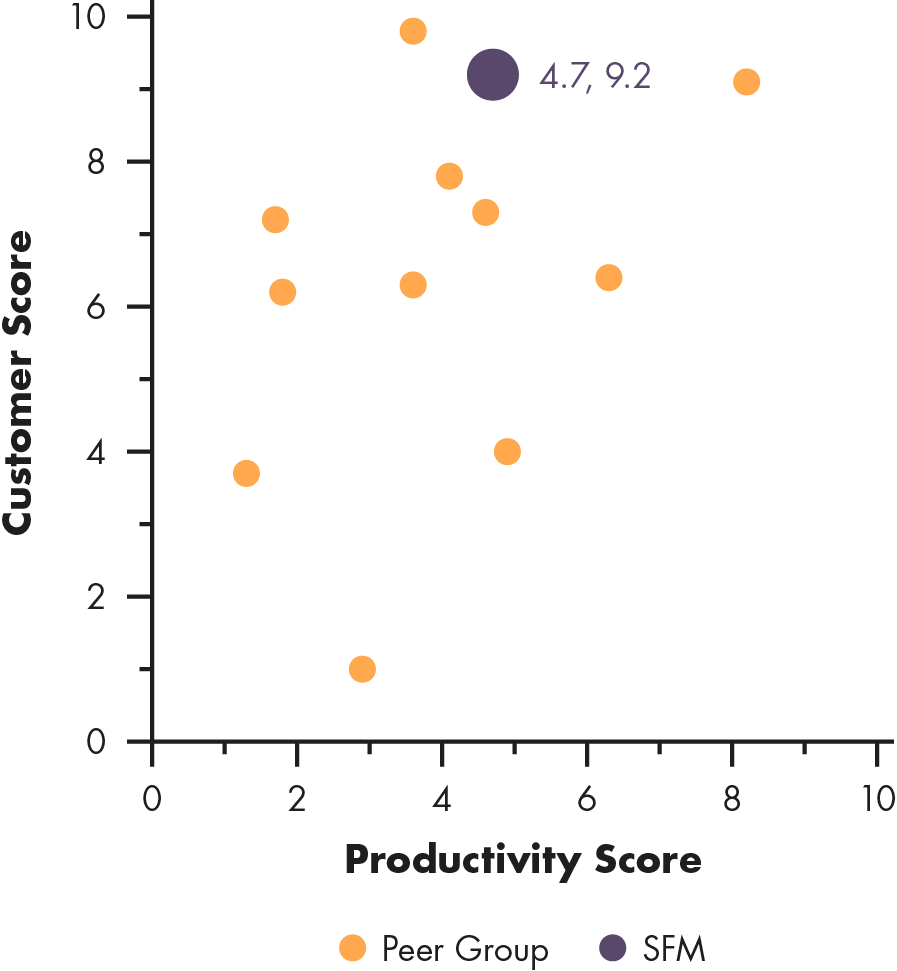
Sprouts Farmers Market’s Customer Score |
||
|---|---|---|
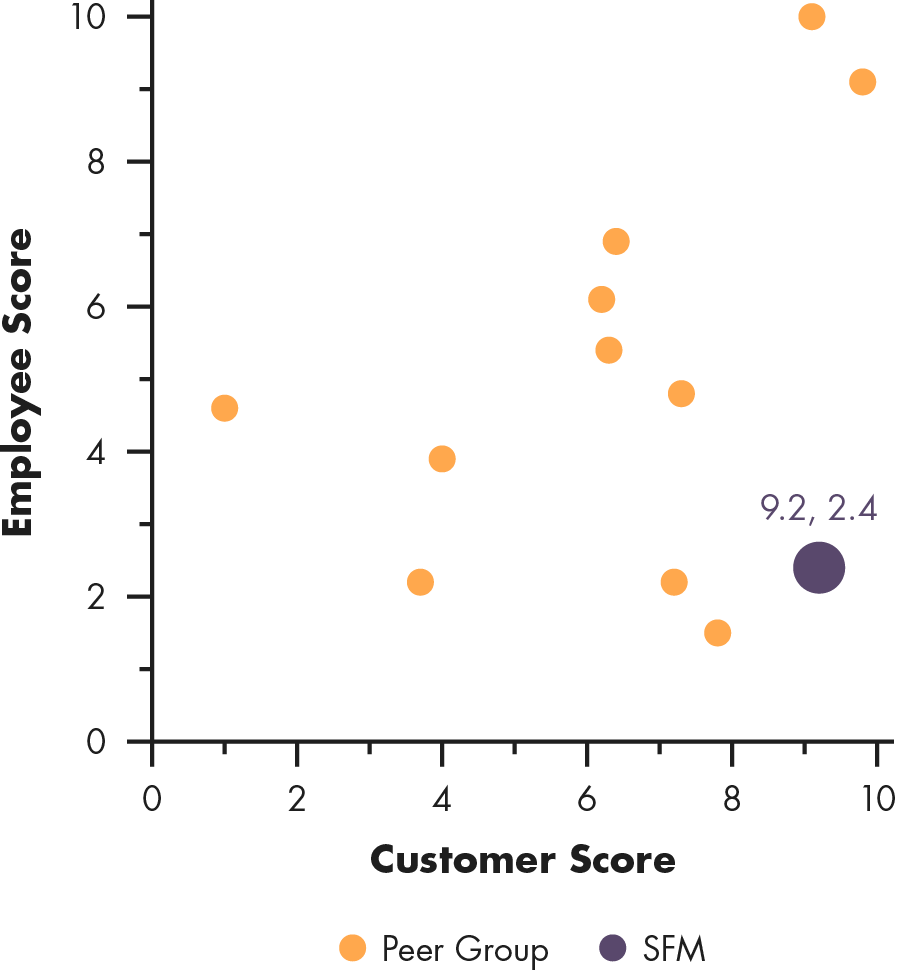
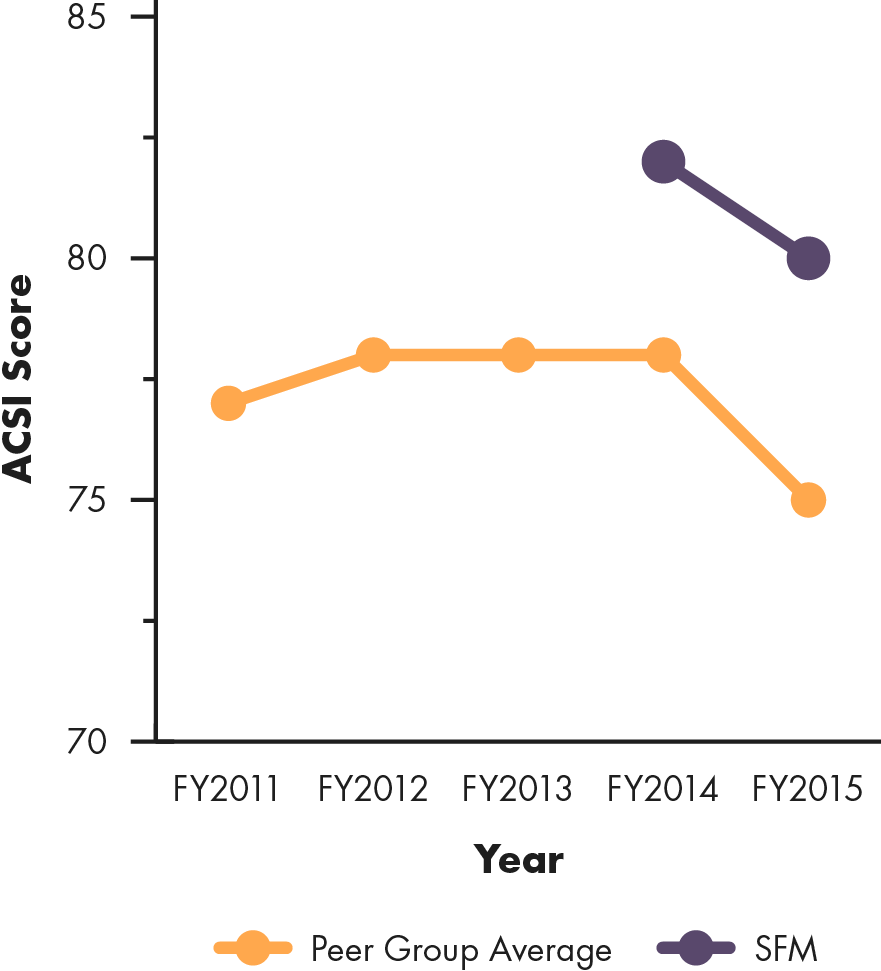
| Customer Score: 9.2Customer Rank: #2 | ||
| For 2016, the Good Jobs Customer component is composed of ASCI and Yelp scores. The 2015 score include Consumer Reports data, unavailable this year due it the biennial schedule of the report. Some companies only have two years of ACSI trend data – these companies are not tracked by the index; their scores are generated by predicting what their scores would have been using their relationship to Yelp data. |
ACSI Trend |
|
Sprouts Farmers Market’s Employee Score |
||
|---|---|---|
| Employee Score: 2.4Employee Rank: #9 | ||
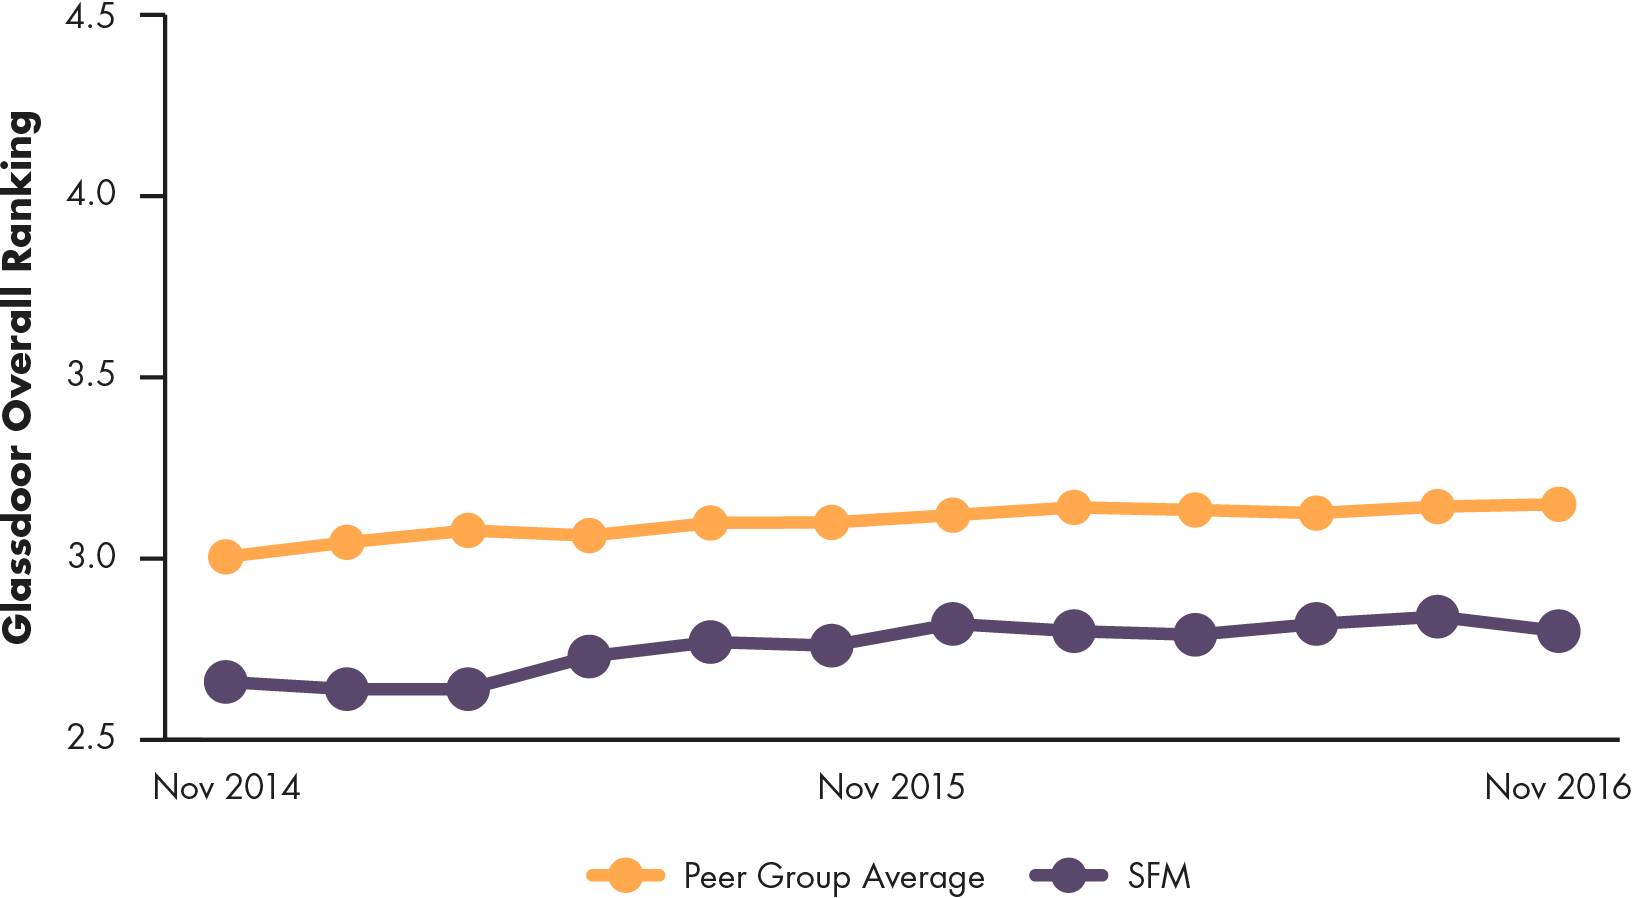
| The Good Jobs Employee component is a composite of Glassdoor and Indeed scores (see Methodology for more details). Glassdoor provides a 2-year trailing score trend, republished here with the peer group average for comparison. |
Sprouts Farmers Market’s Glassdoor Rating Trend |
|
Sprouts Farmers Market’s Productivity Score |
||
|---|---|---|
| Productivity Score: 4.7Productivity Rank: #4 | ||
|
Sales/SQFT
|
Sales/Employee
|
Inventory Turnover
|

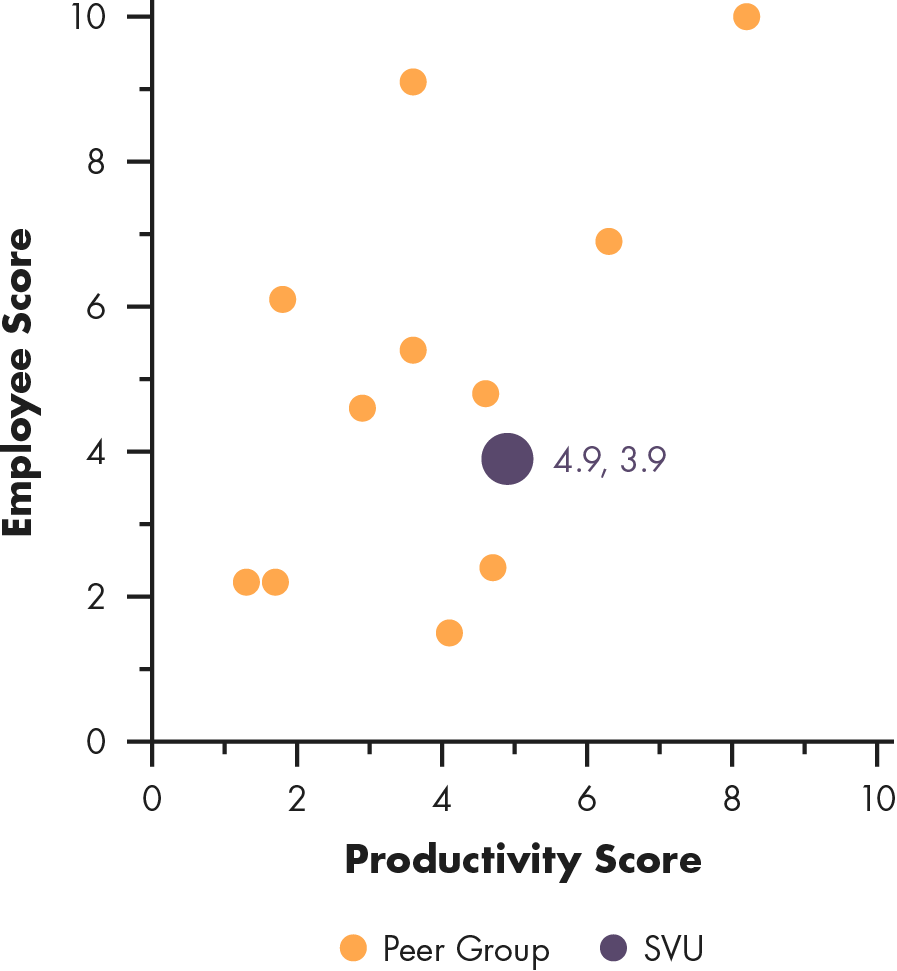
Supervalu (NYSE:SVU)
Supervalu is a publicly traded grocery store chain that operates in three segments: Independent Business wholesale business with 2,243 stores; Save-A-Lot, their hard discount grocery chain with 1,334 owned and licensed stores; and their Retail Food segment, which consists of 190 retail food stores under five regionally-based grocery banners of Cub Foods, Shoppers Food & Pharmacy, Shop ‘n Save, Farm Fresh and Hornbacher’s. In late 2016, Supervalu agreed to sell the Save-A-Lot business to Onex Corporation, a Canadian private equity firm.
Supervalu’s total revenue in 2015 was $17.8 billion, of which approximately 47% is attributable to the wholesale business. It reports revenue under three segments: Independent Business, Save-a-Lot, and Retail Food. Because the Independent Business segment relates to wholesale operations it is excluded in our analysis. Supervalu employed approximately 38,000. Supervalu does not report their average number of SKUs, but they carry an assortment of grocery items including fresh produce, flowers and gifts, pharmacy items, and health and beauty products. Their mission states that Supervalu will always serve their customers better than anyone else could serve them. It will provide customers with value through products and services, committing itself to providing the quality, variety and convenience they expect.
Supervalu’s Good Jobs Score Overview |
||
|---|---|---|
| Overall Score: 4.2Overall Rank: #7 | ||
|
Customer/Employee Scores
|
Productivity/Customer Scores
|
Productivity/Employee Scores
|
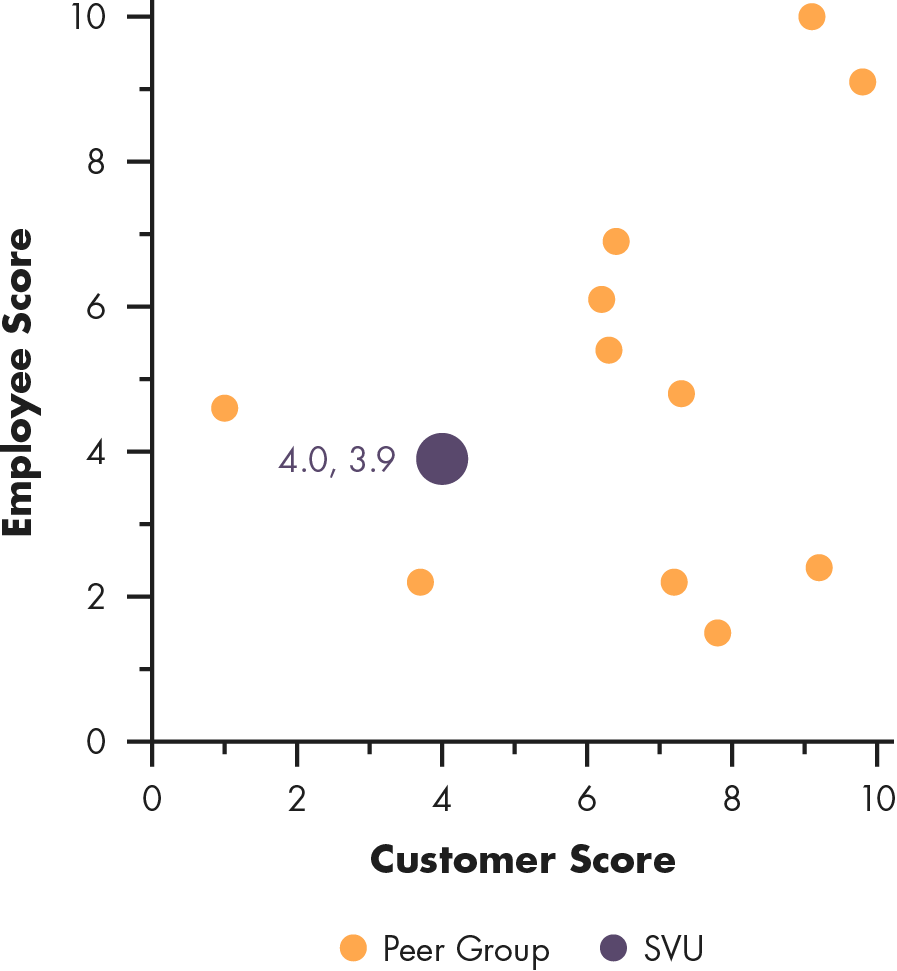
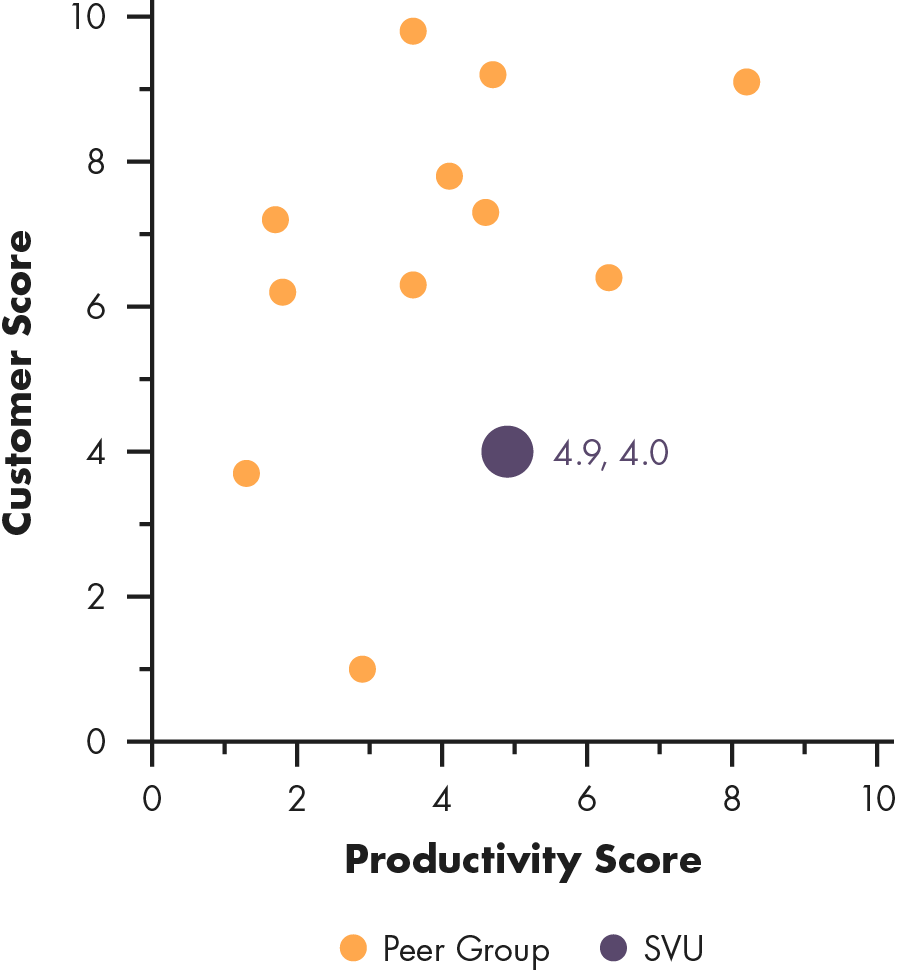
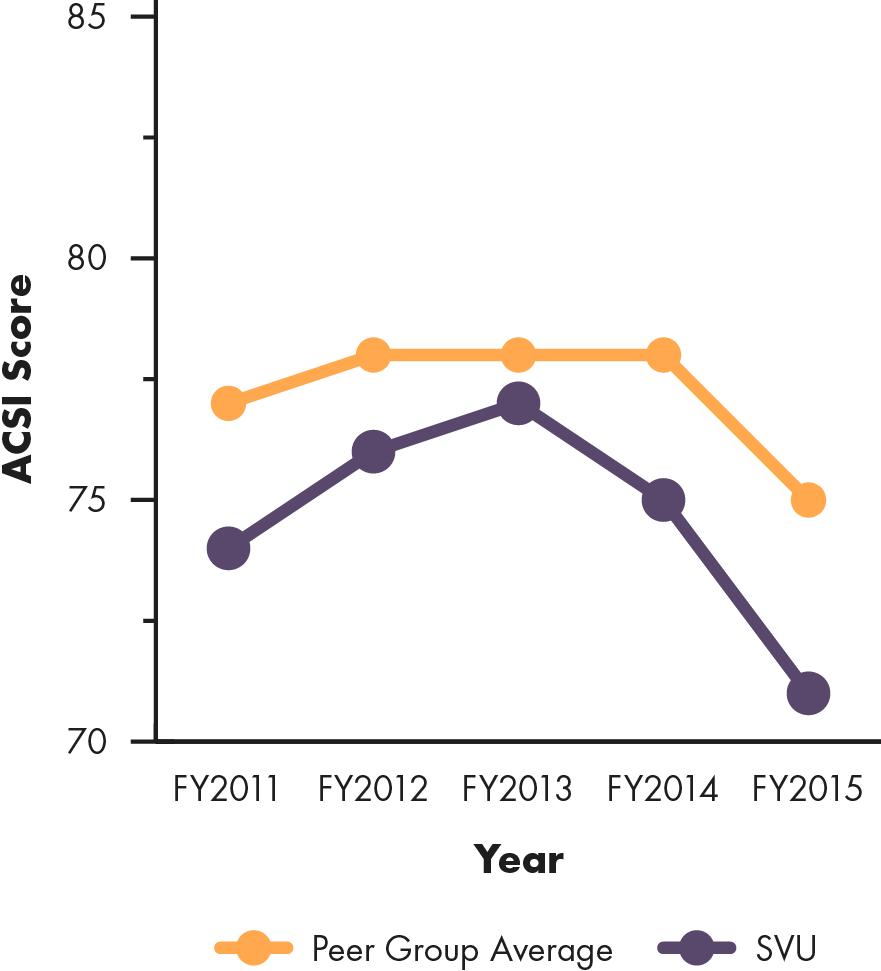
Supervalu’s Customer Score |
||
|---|---|---|
| Customer Score: 4.0Customer Rank: #10 | ||
| For 2016, the Good Jobs Customer component is composed of ASCI and Yelp scores. The 2015 score include Consumer Reports data, unavailable this year due it the biennial schedule of the report. Some companies only have two years of ACSI trend data – these companies are not tracked by the index; their scores are generated by predicting what their scores would have been using their relationship to Yelp data. |
ACSI Trend |
|
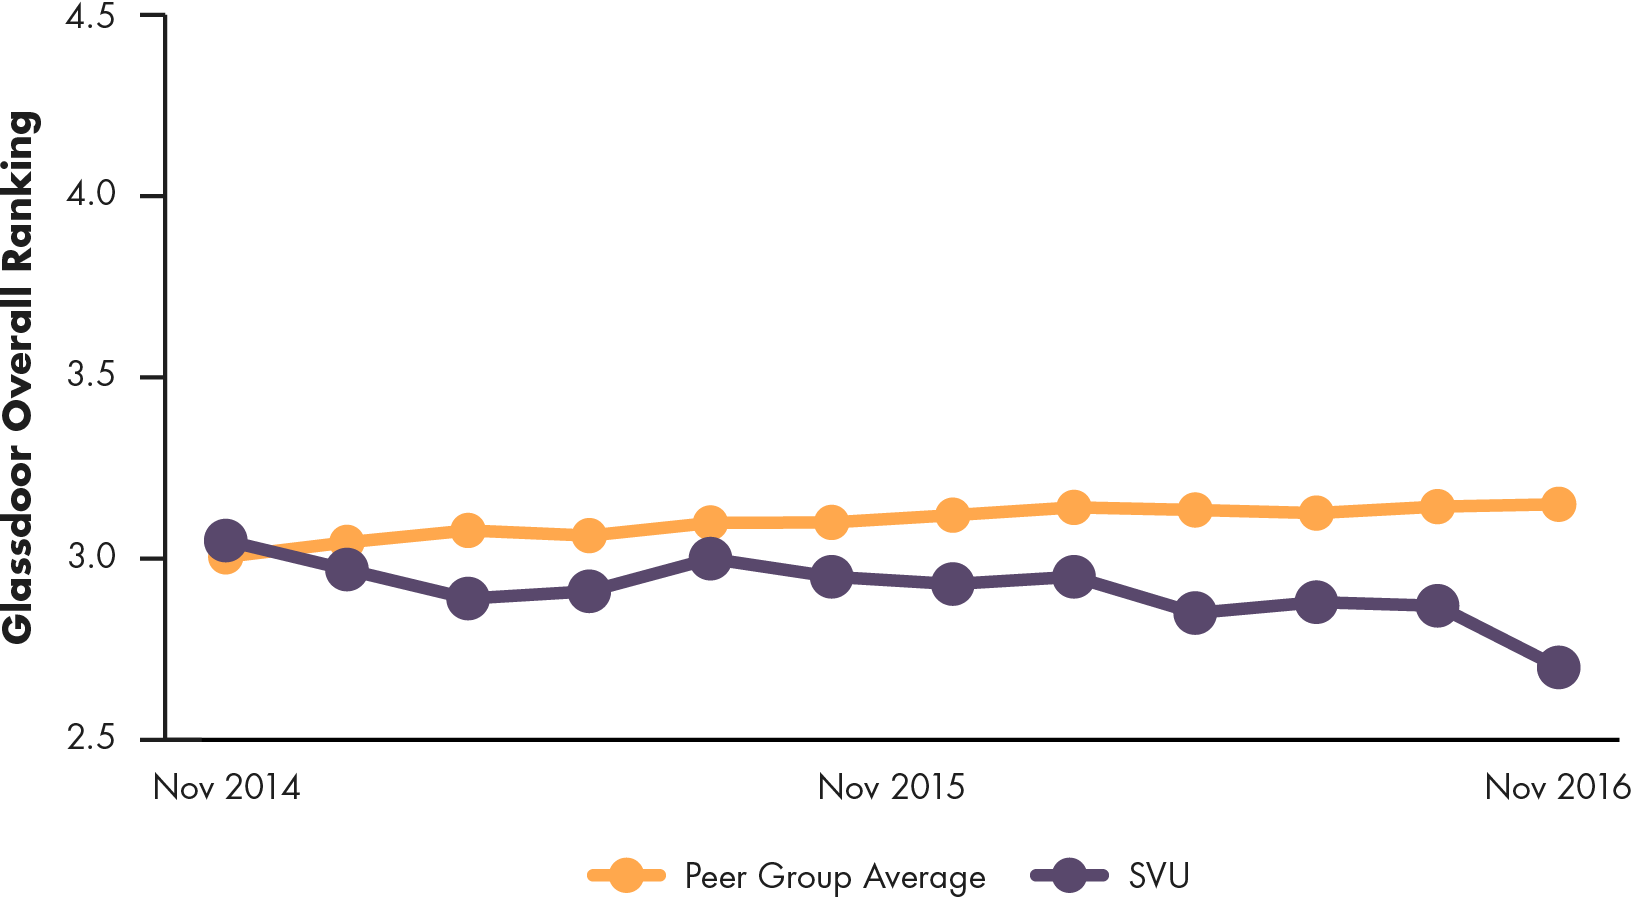
Supervalu’s Employee Score |
||
|---|---|---|
| Employee Score: 3.9Employee Rank: #8 | ||
| The Good Jobs Employee component is a composite of Glassdoor and Indeed scores (see Methodology for more details). Glassdoor provides a 2-year trailing score trend, republished here with the peer group average for comparison. |
Supervalu’s Glassdoor Rating Trend |
|
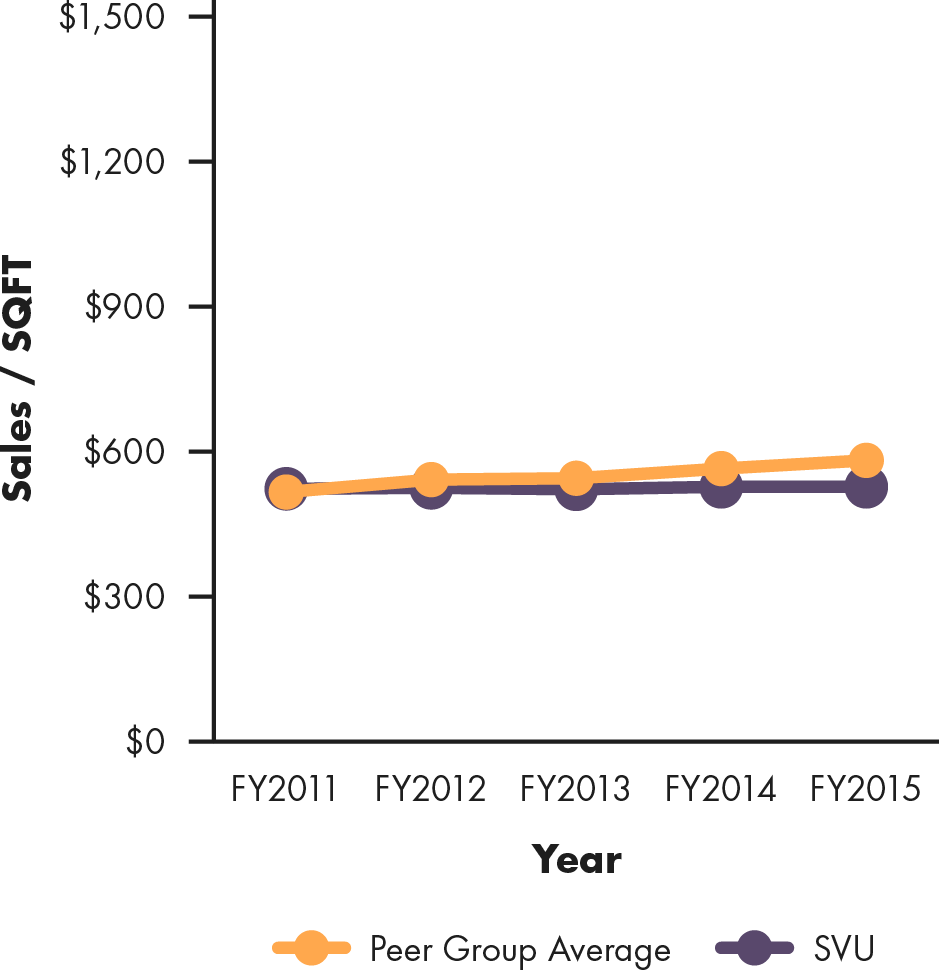
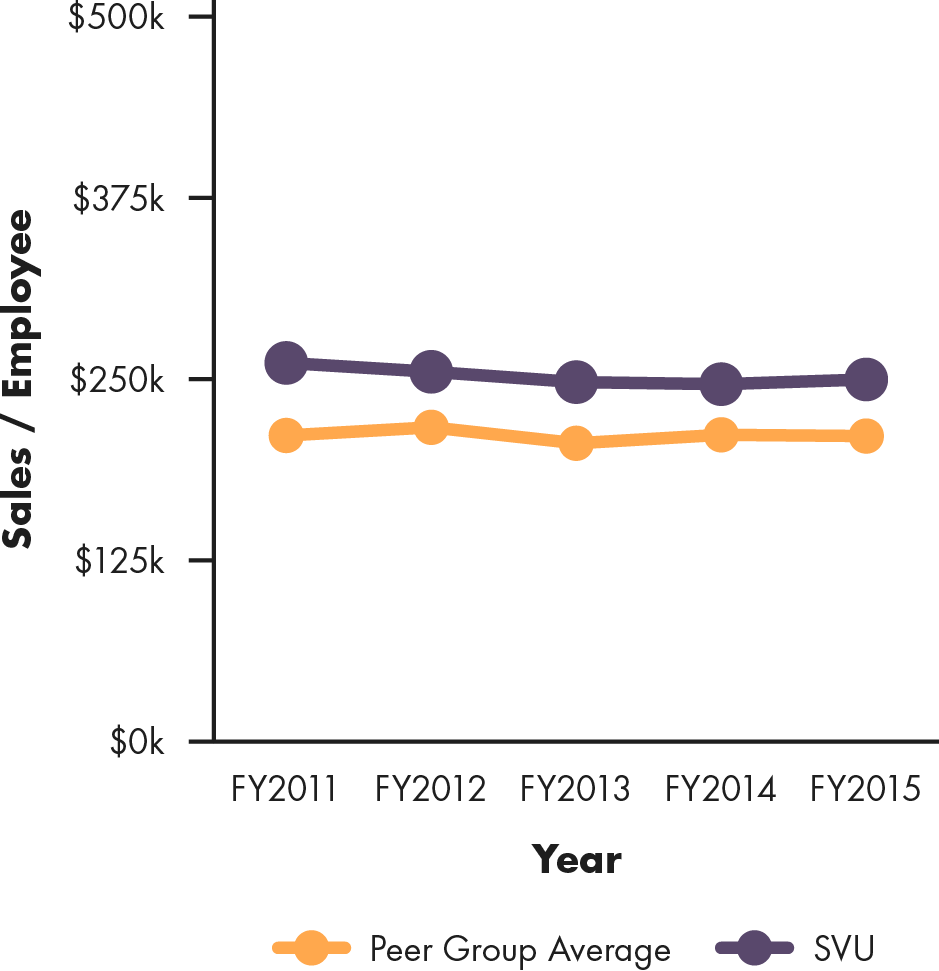
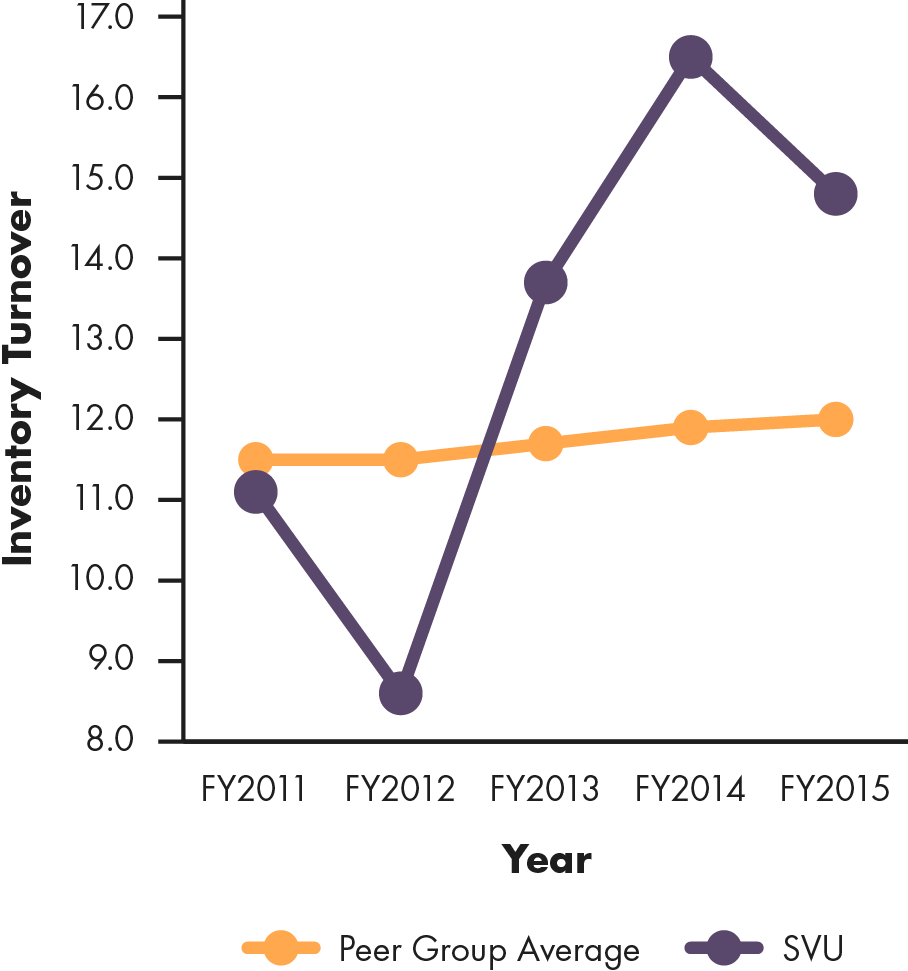
Supervalu’s Productivity Score |
||
|---|---|---|
| Productivity Score: 4.9Productivity Rank: #3 | ||
|
Sales/SQFT
|
Sales/Employee
|
Inventory Turnover
|
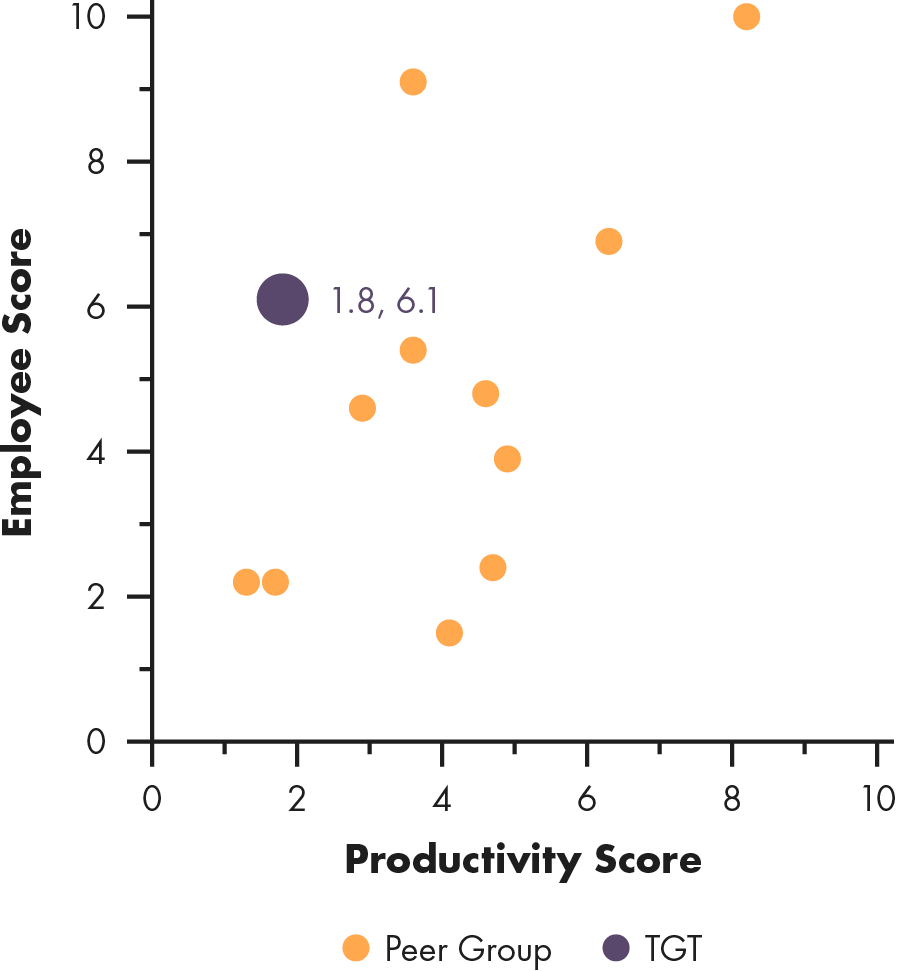
Target (NYSE:TGT)
Target is a publicly traded retail chain operating with 1,792 stores. Target operations include general merchandise stores offering an edited food assortment of perishables, dry grocery, dairy and frozen items; SuperTarget stores offering a full line of food items comparable to traditional supermarkets; and a small number of urban format stores, CityTarget and TargetExpress, offering edited general merchandise and food assortments. These formats are in addition to their traditional expanded food assortment stores.
Target’s 2015 revenue was $73.8 billion and it employed approximately 341,000. Each Target carries an average of 70,000 SKUs, with items ranging from canned non-perishable groceries to televisions. Target’s stated mission is to make Target their customers’ preferred shopping destination in all channels by delivering outstanding value, continuous innovation and exceptional guest experiences by consistently fulfilling their “Expect More. Pay Less.” brand promise.
Target’s Good Jobs Score Overview |
||
|---|---|---|
| Overall Score: 4.1Overall Rank: #8 | ||
|
Customer/Employee Scores
|
Productivity/Customer Scores
|
Productivity/Employee Scores
|
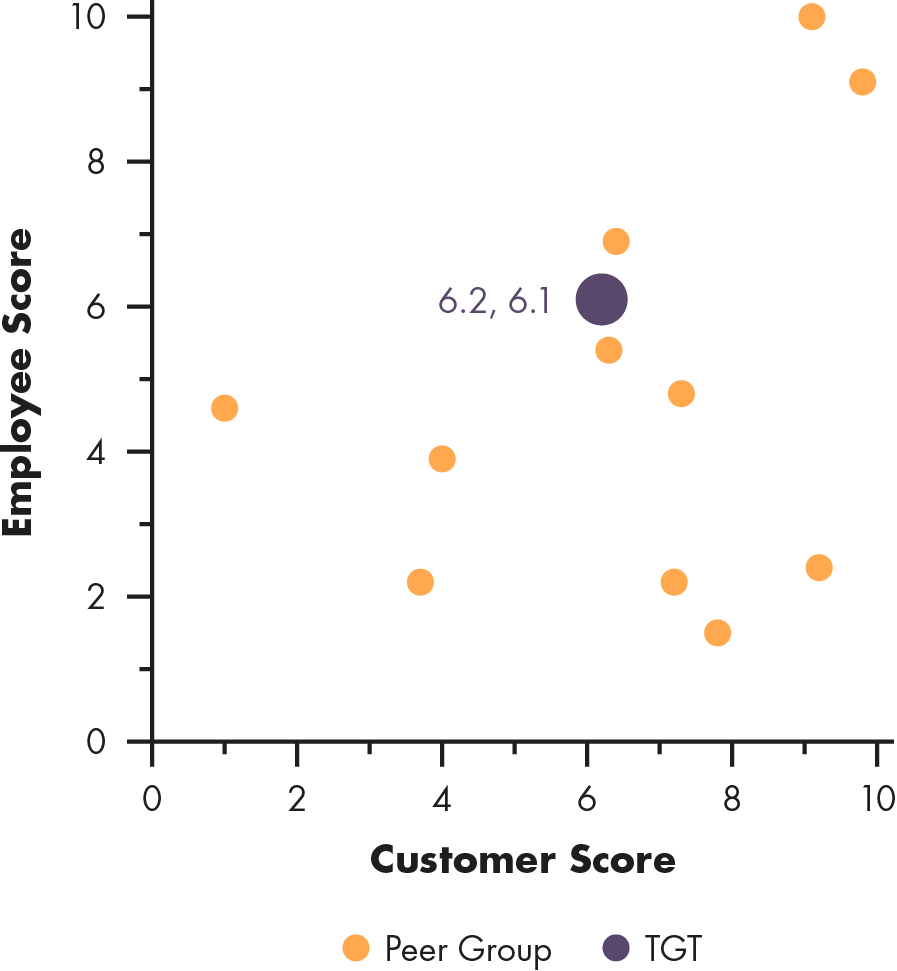
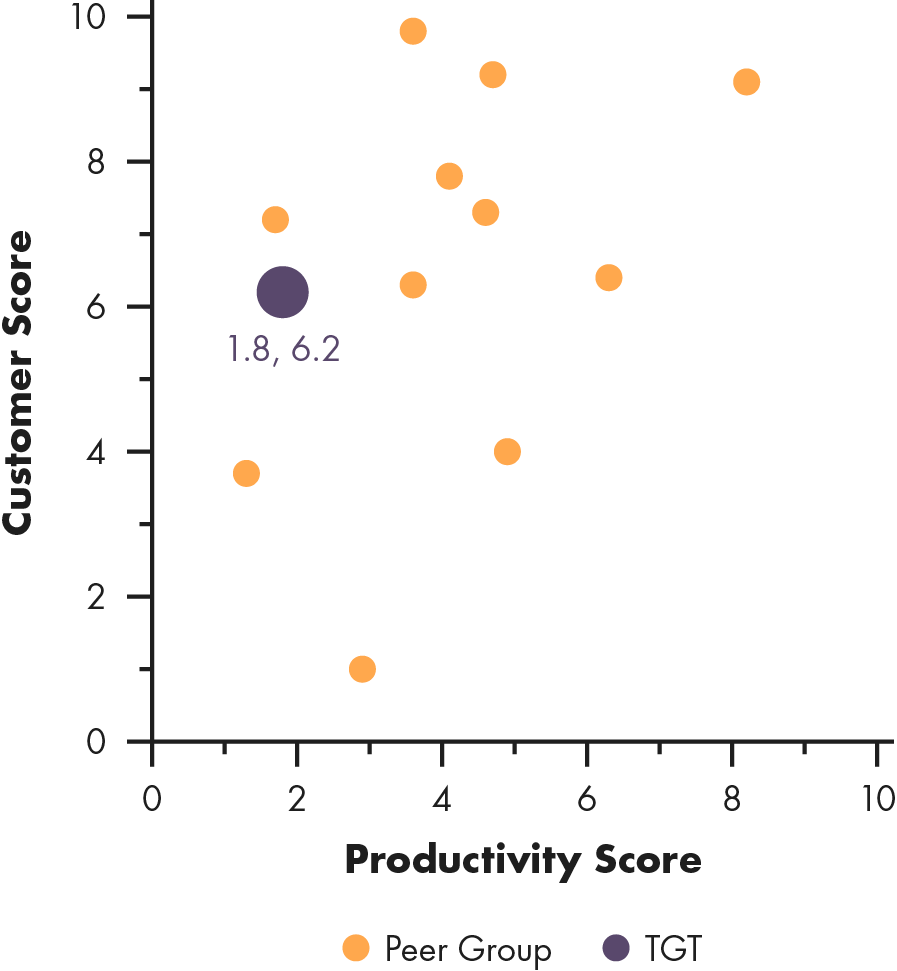
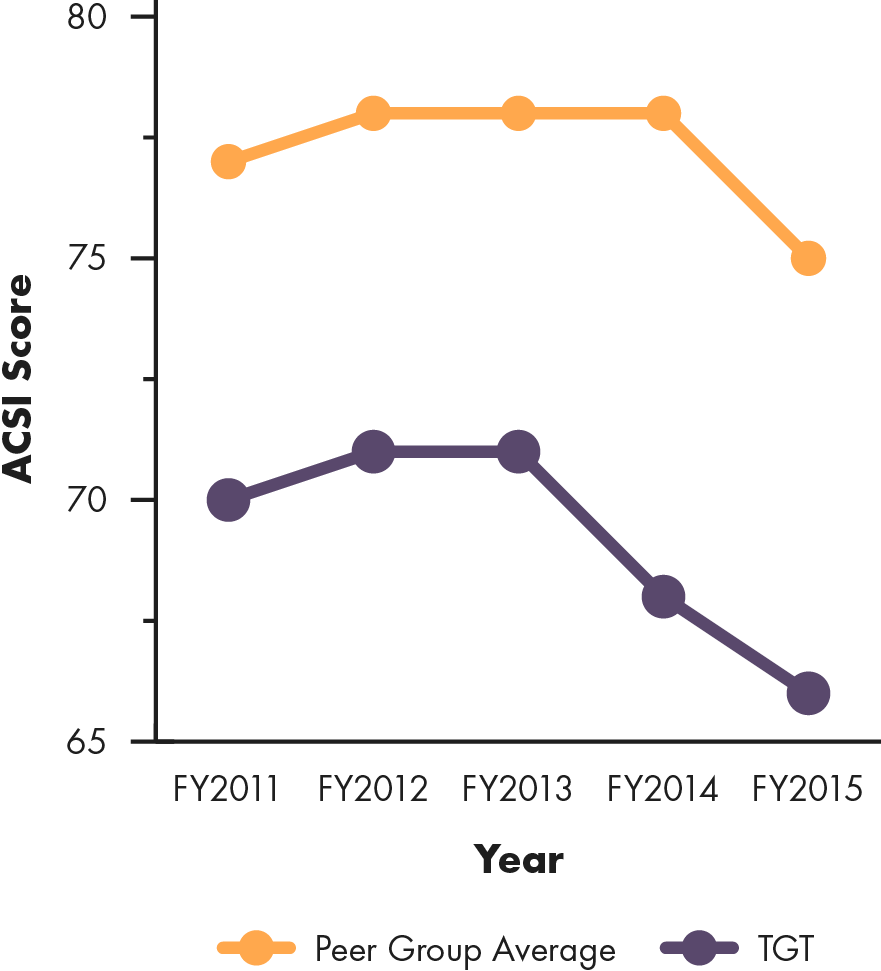
Target’s Customer Score |
||
|---|---|---|
| Customer Score: 6.2Customer Rank: #9 | ||
| For 2016, the Good Jobs Customer component is composed of ASCI and Yelp scores. The 2015 score include Consumer Reports data, unavailable this year due it the biennial schedule of the report. Some companies only have two years of ACSI trend data – these companies are not tracked by the index; their scores are generated by predicting what their scores would have been using their relationship to Yelp data. |
ACSI Trend |
|
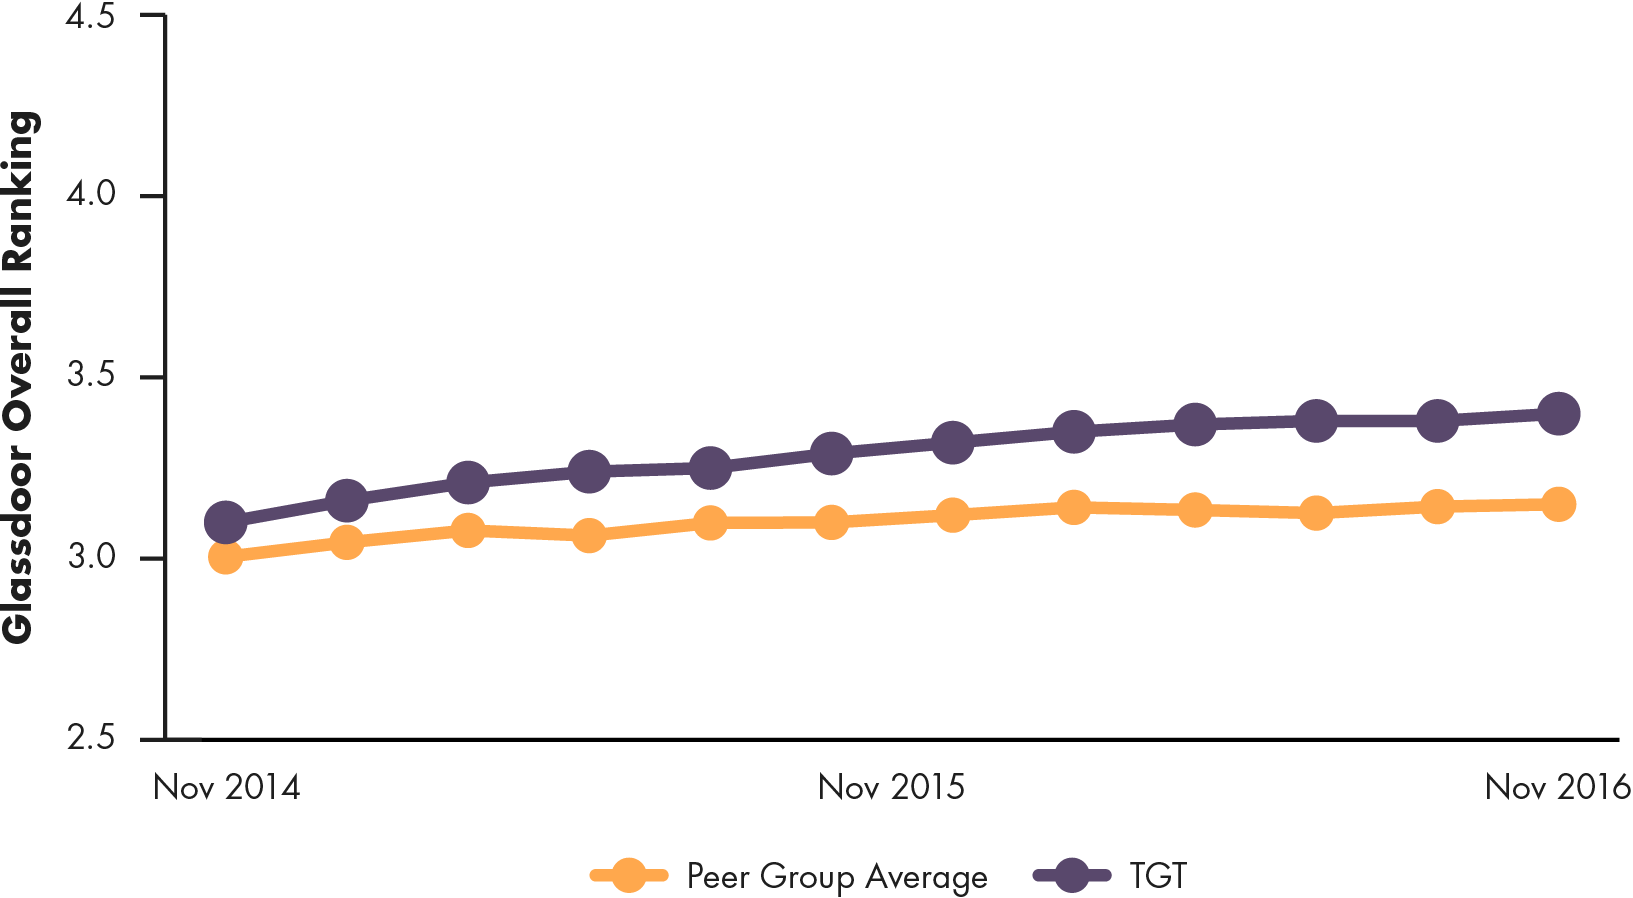
Target’s Employee Score |
||
|---|---|---|
| Employee Score: 6.1Employee Rank: #4 | ||
| The Good Jobs Employee component is a composite of Glassdoor and Indeed scores (see Methodology for more details). Glassdoor provides a 2-year trailing score trend, republished here with the peer group average for comparison. |
Target’s Glassdoor Rating Trend |
|
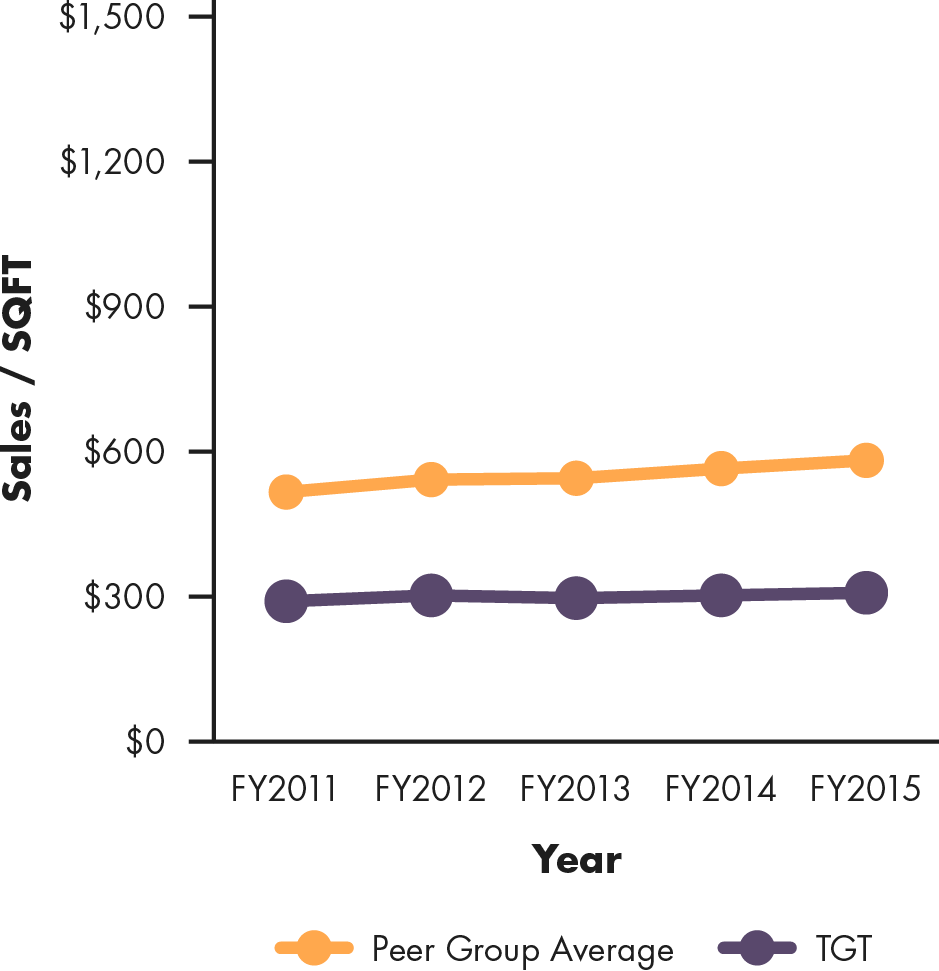
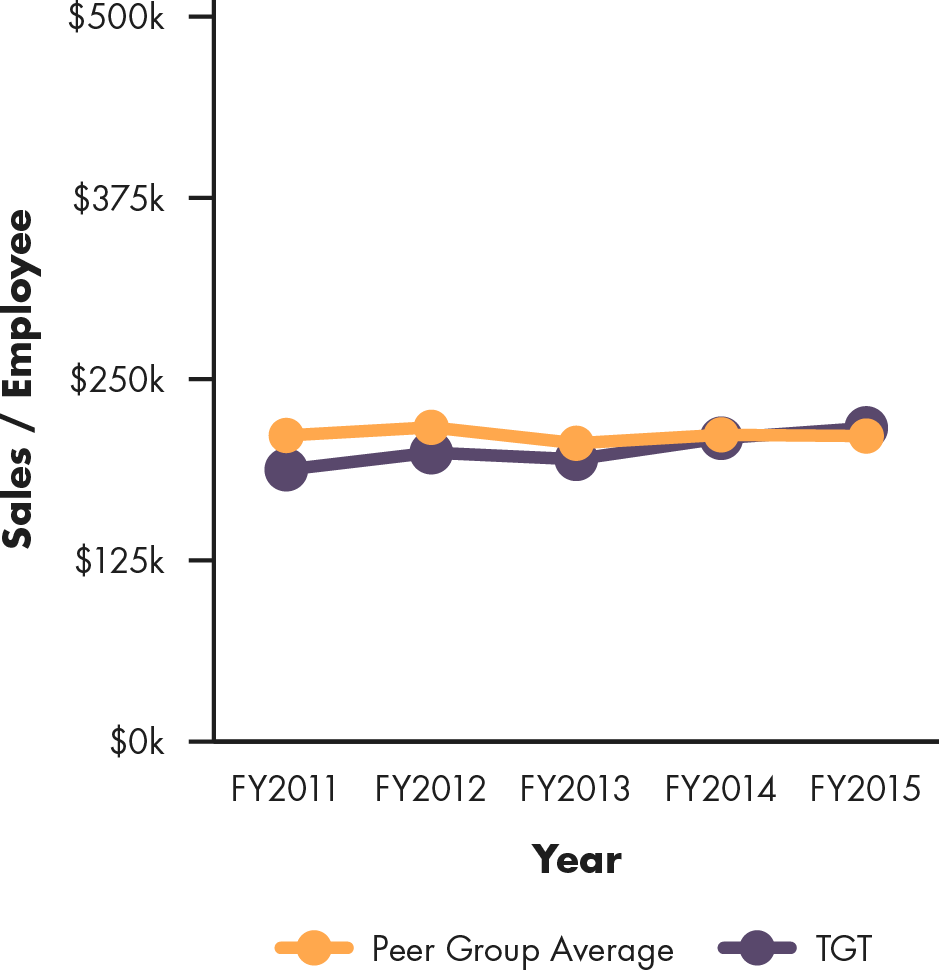
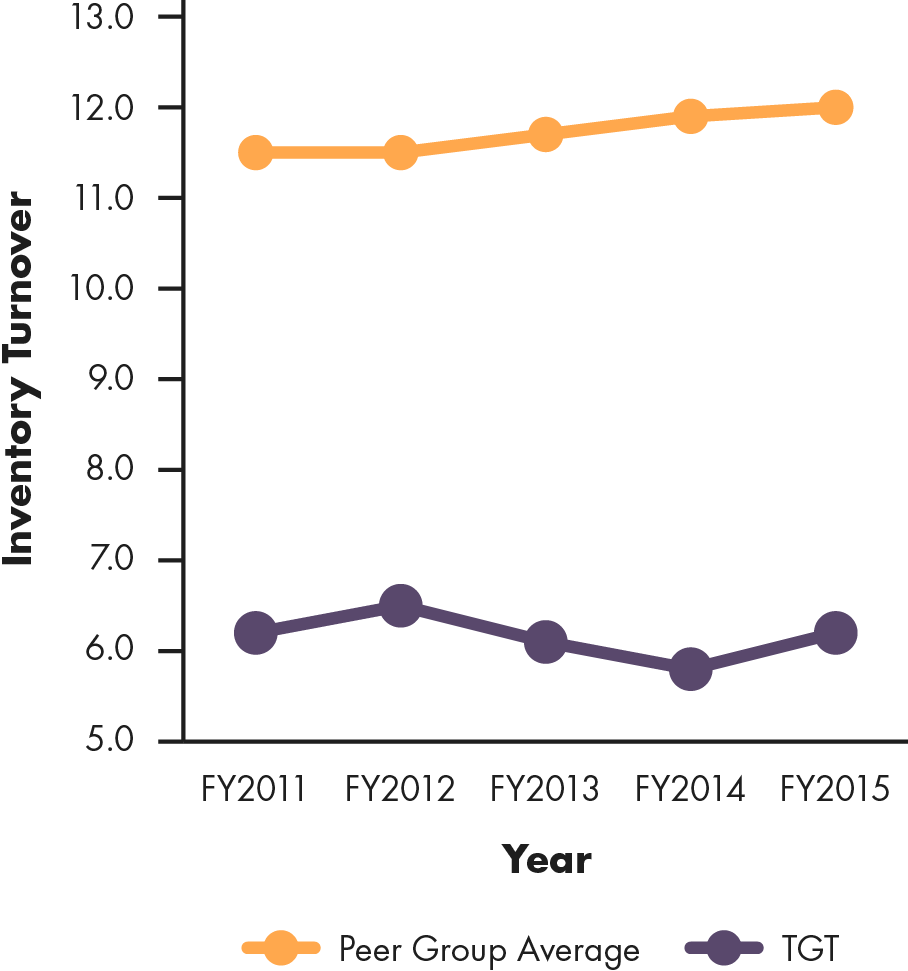
Target’s Productivity Score |
||
|---|---|---|
| Productivity Score: 1.8Productivity Rank: #10 | ||
|
Sales/SQFT
|
Sales/Employee
|
Inventory Turnover
|
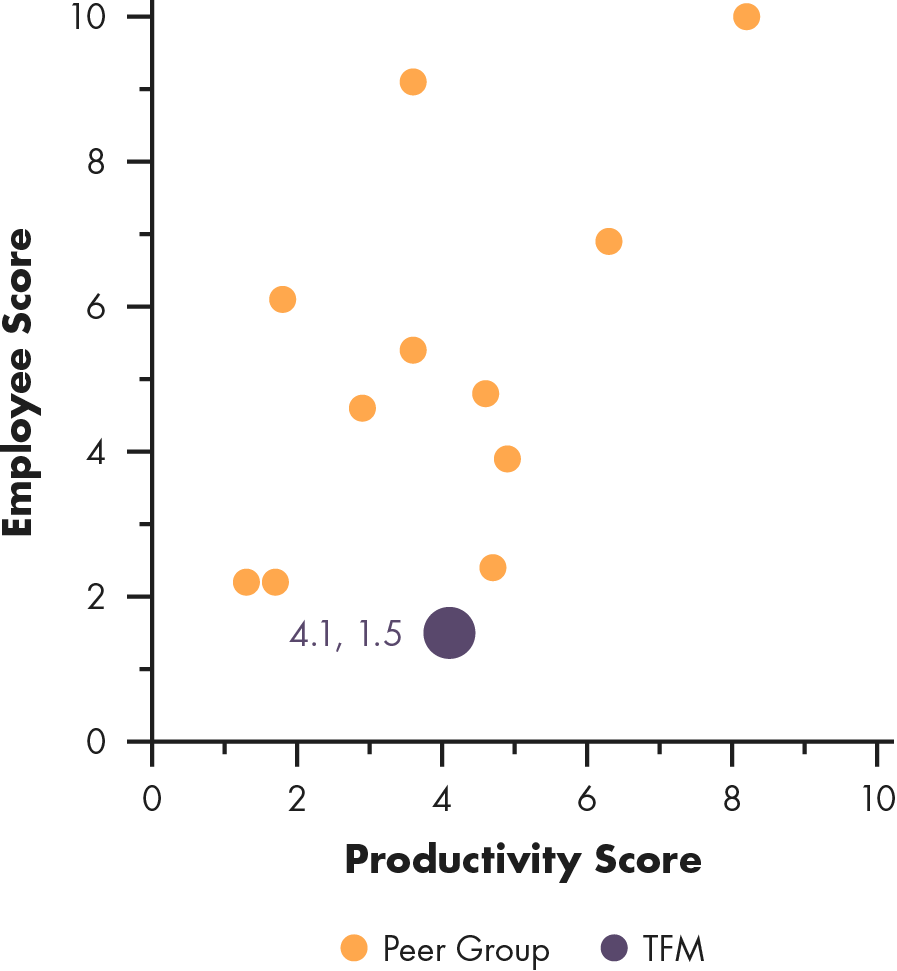
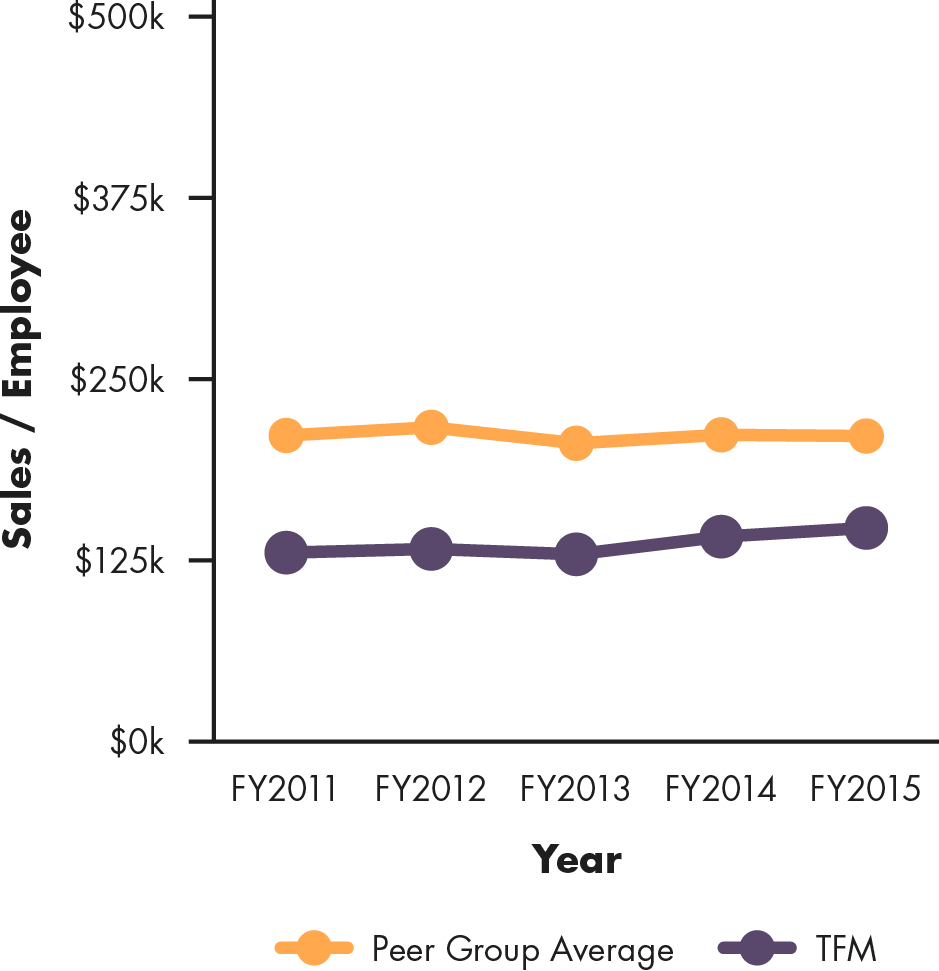
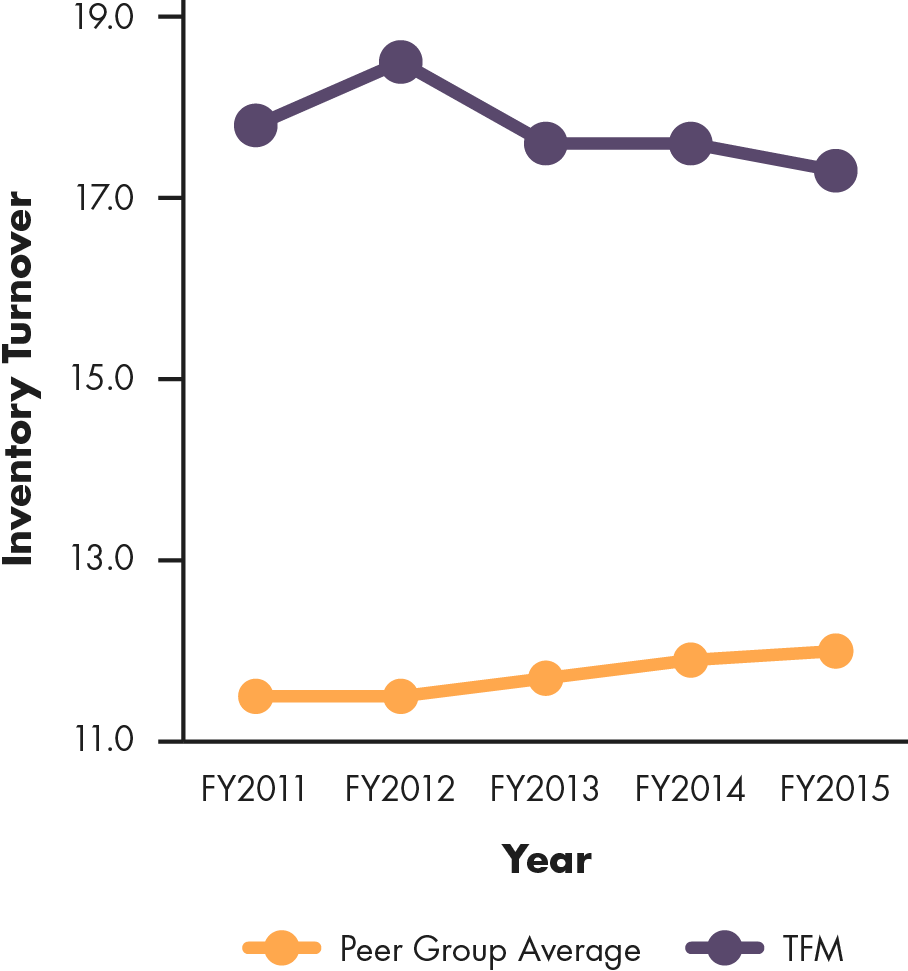
The Fresh Market (NASDAQ:TFM)
The Fresh Market is a publicly traded grocery store chain with 187 stores. 2015 revenue was $1.8 billion and it employed approximately 12,600 people. Each Fresh Market carries an average of 9,500 SKUs, with an assortment of grocery items including fresh produce, flowers and gifts, prepared foods, and bulk snacks. Their stated mission or value proposition is to provide outstanding food quality, store environment and customer service, and to focus on higher-margin food categories.
The Fresh Market’s Good Jobs Score Overview |
||
|---|---|---|
| Overall Score: 3.6Overall Rank: #9 | ||
|
Customer/Employee Scores
|
Productivity/Customer Scores
|
Productivity/Employee Scores
|
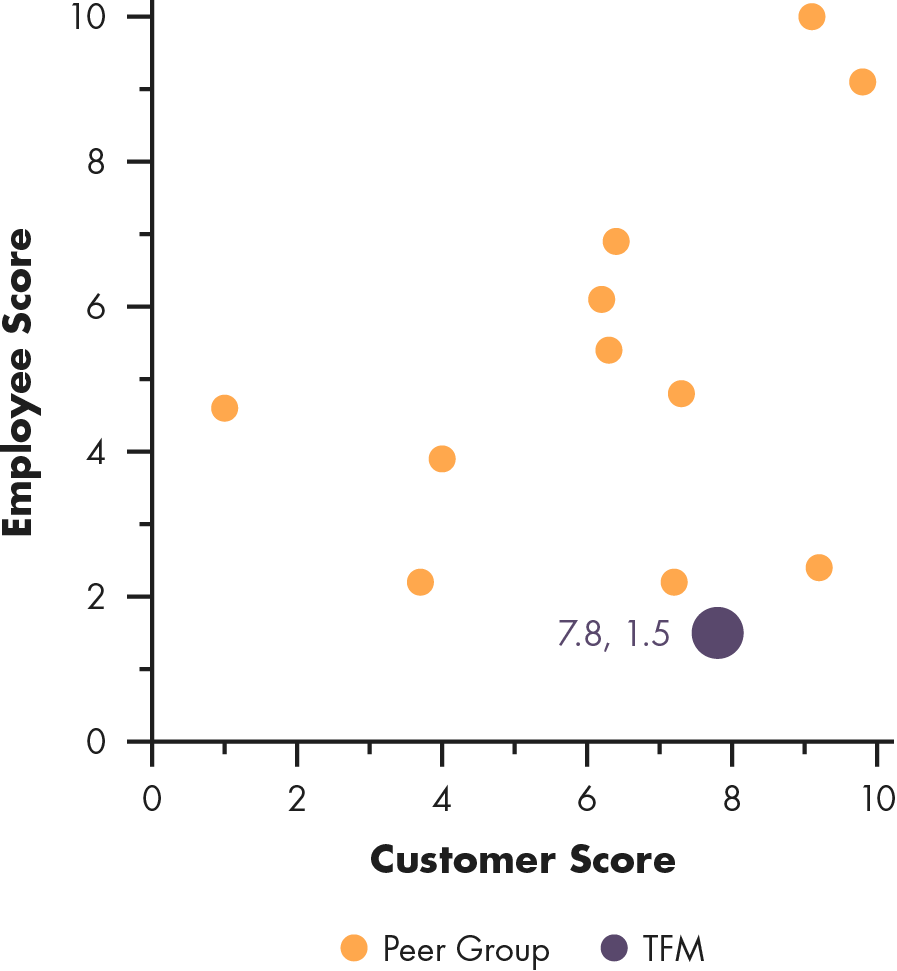
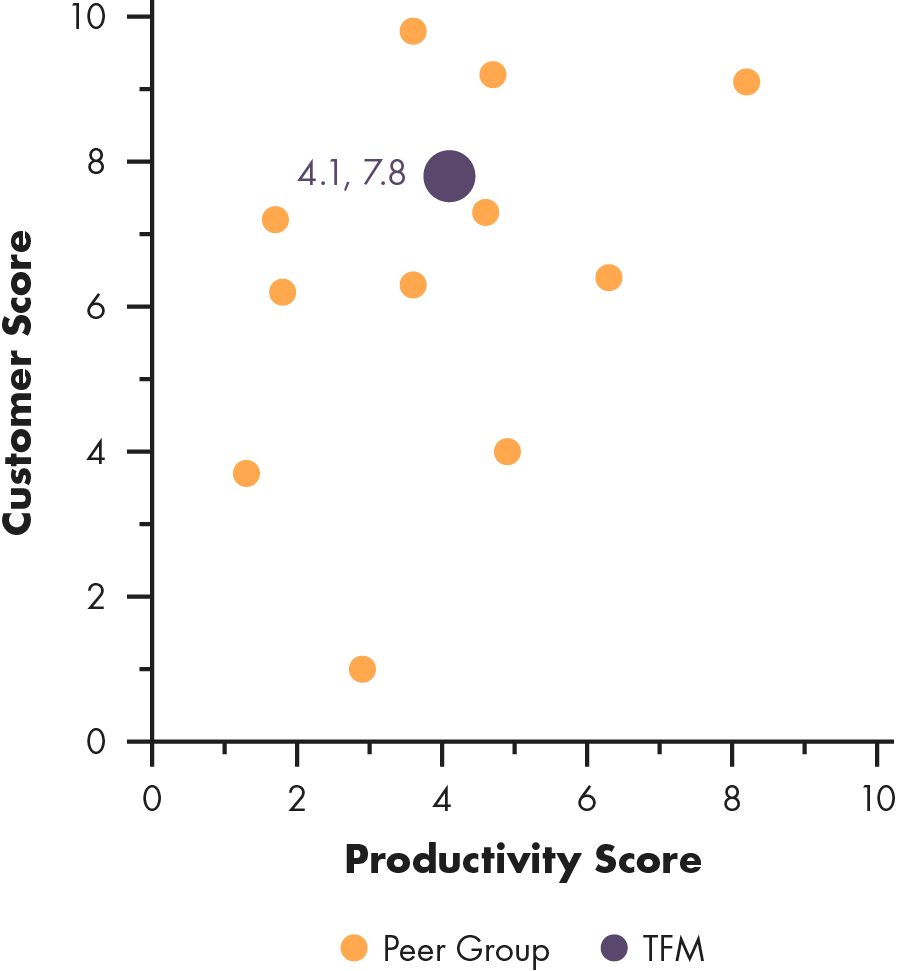
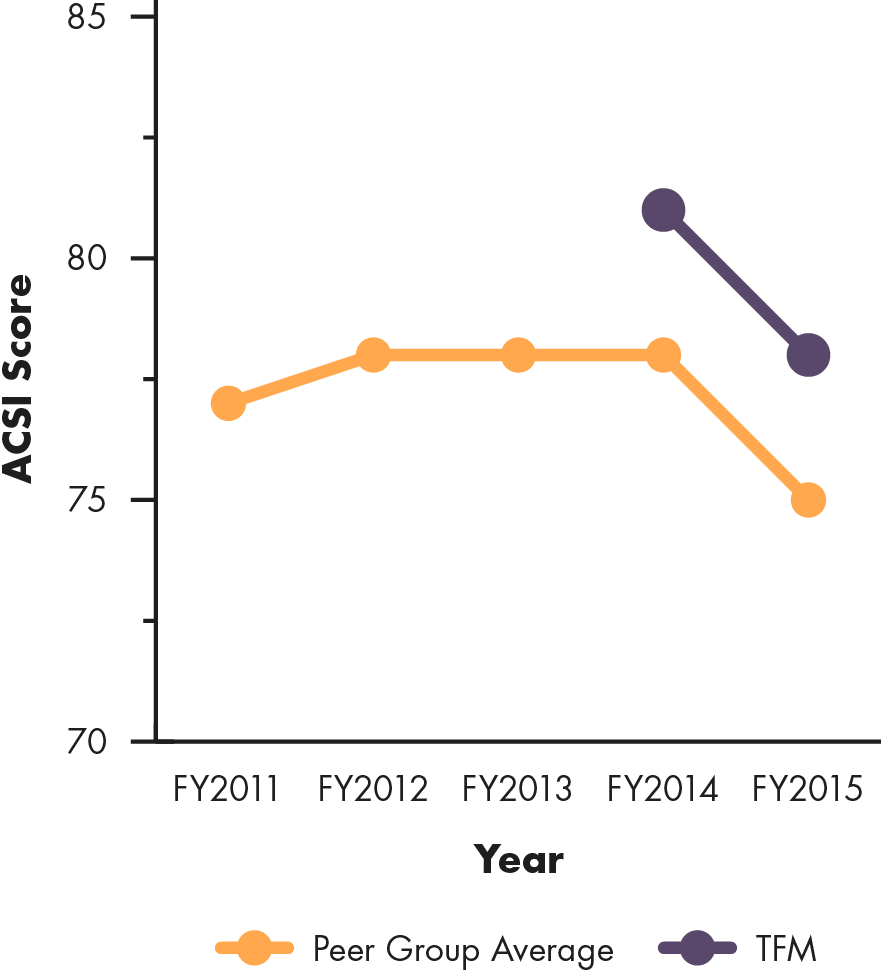
The Fresh Market’s Customer Score |
||
|---|---|---|
| Customer Score: 7.8Customer Rank: #4 | ||
| For 2016, the Good Jobs Customer component is composed of ASCI and Yelp scores. The 2015 score include Consumer Reports data, unavailable this year due it the biennial schedule of the report. Some companies only have two years of ACSI trend data – these companies are not tracked by the index; their scores are generated by predicting what their scores would have been using their relationship to Yelp data. |
ACSI Trend |
|
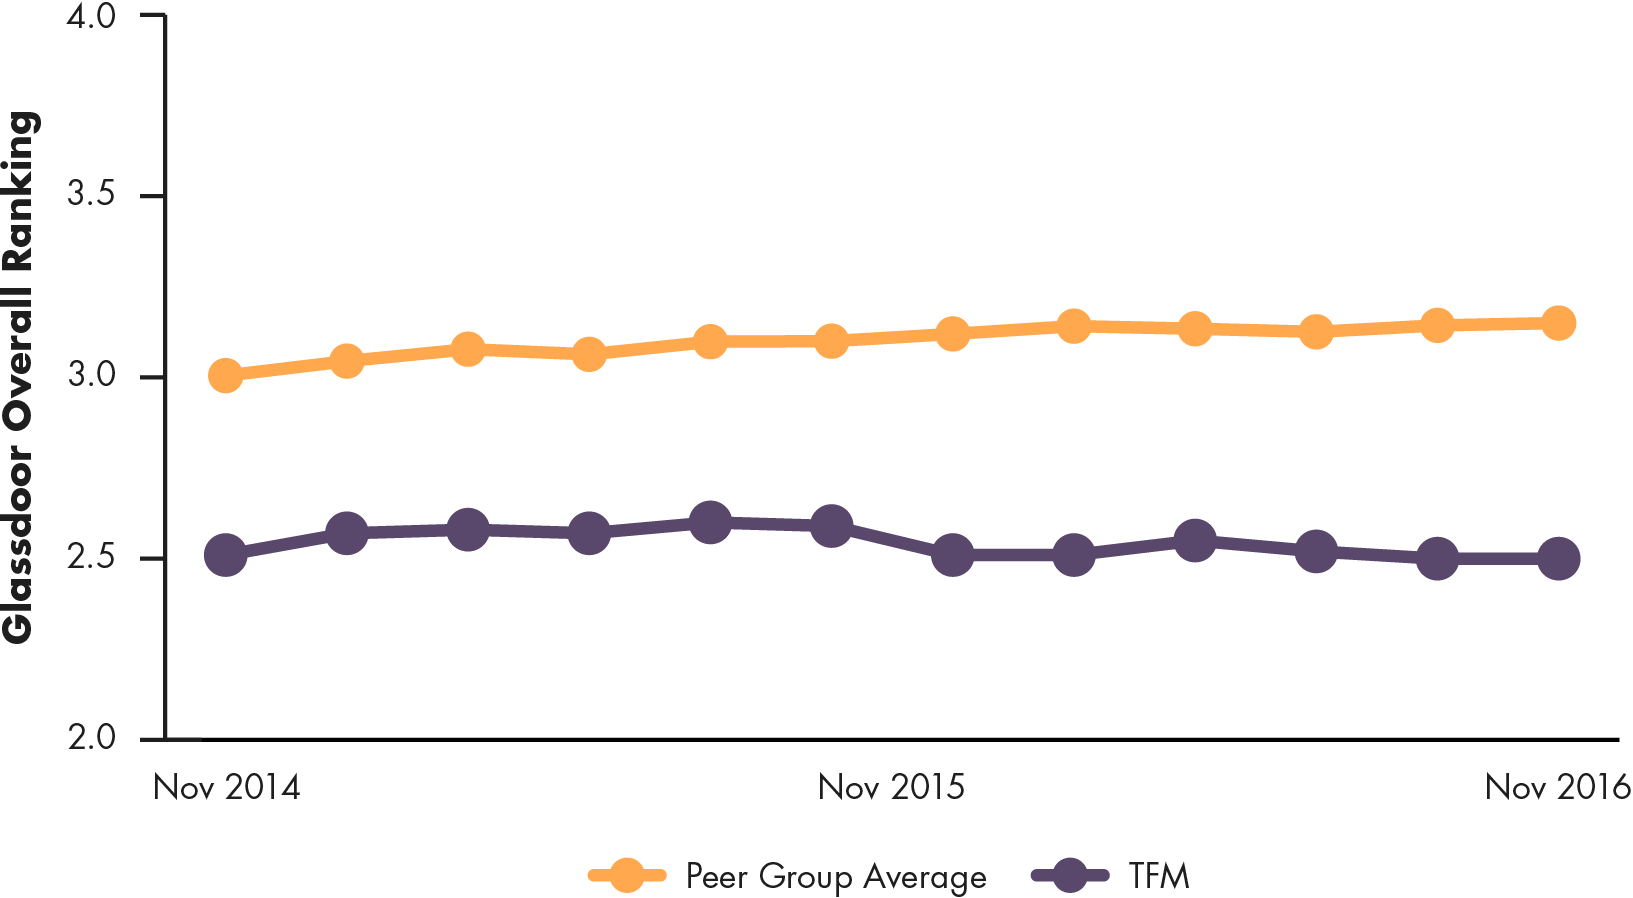
The Fresh Market’s Employee Score |
||
|---|---|---|
| Employee Score: 1.5Employee Rank: #12 | ||
| The Good Jobs Employee component is a composite of Glassdoor and Indeed scores (see Methodology for more details). Glassdoor provides a 2-year trailing score trend, republished here with the peer group average for comparison. |
The Fresh Market’s Glassdoor Rating Trend |
|
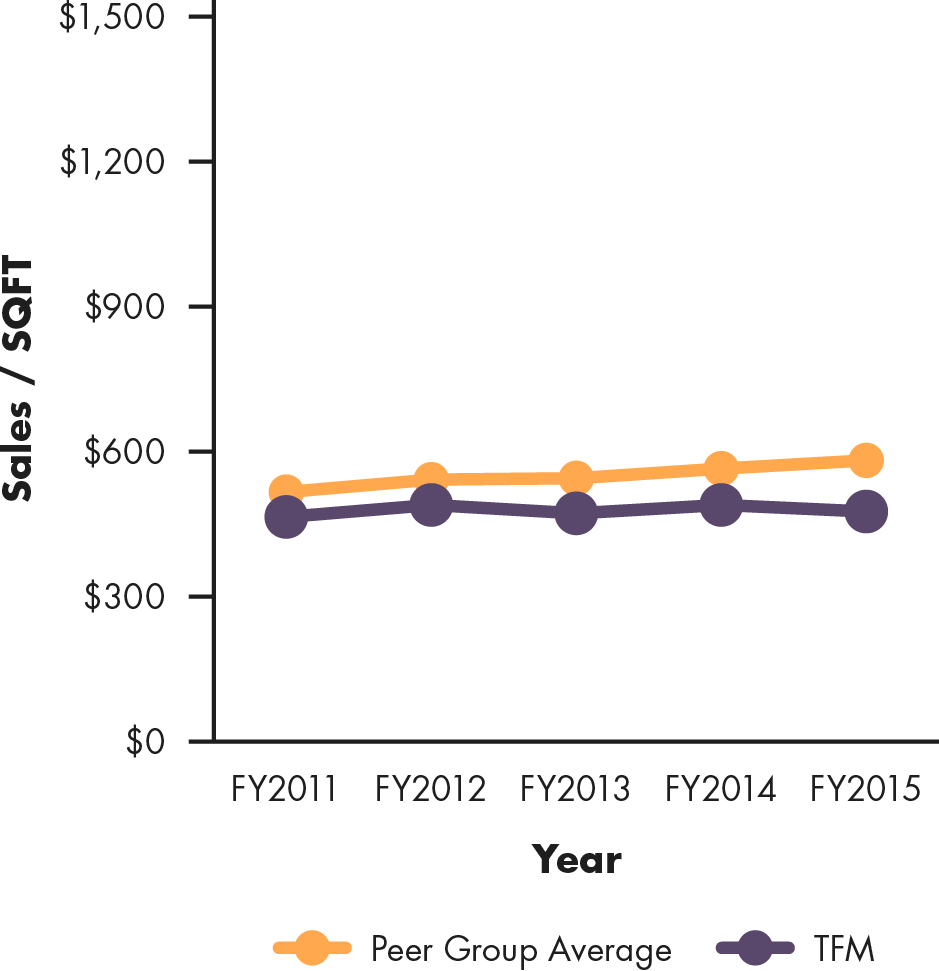
The Fresh Market’s Productivity Score |
||
|---|---|---|
| Productivity Score: 4.1Productivity Rank: #6 | ||
|
Sales/SQFT
|
Sales/Employee
|
Inventory Turnover
|
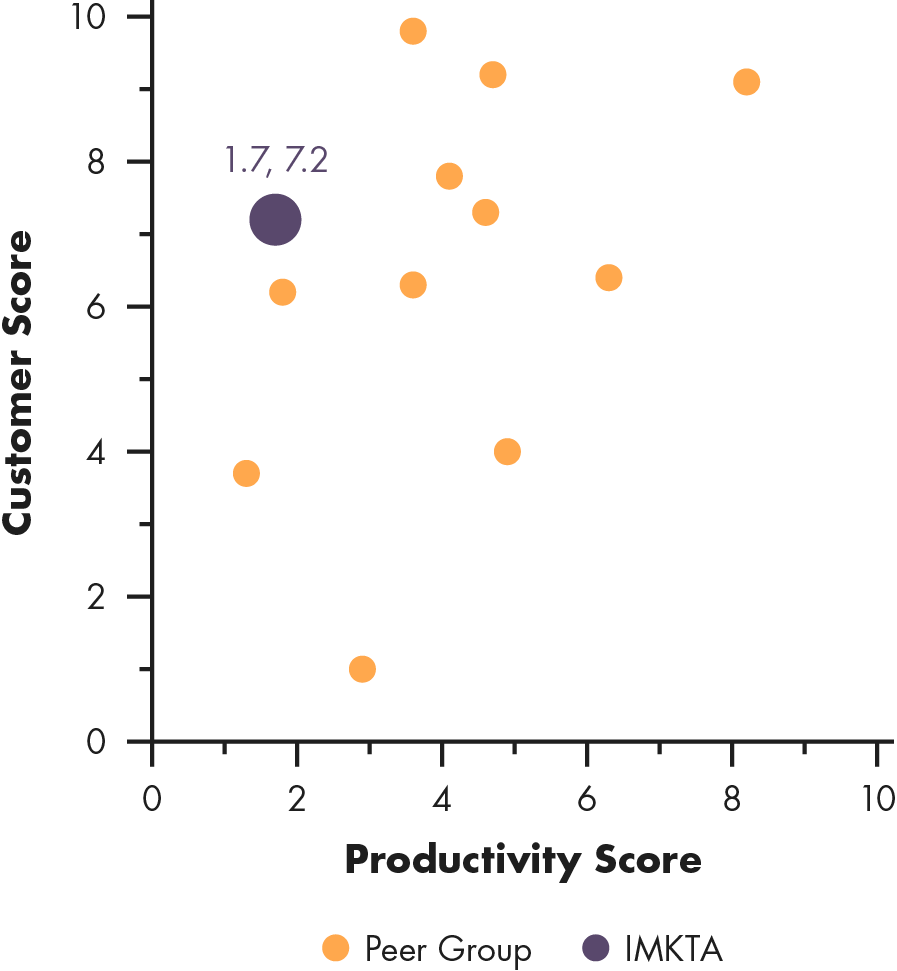
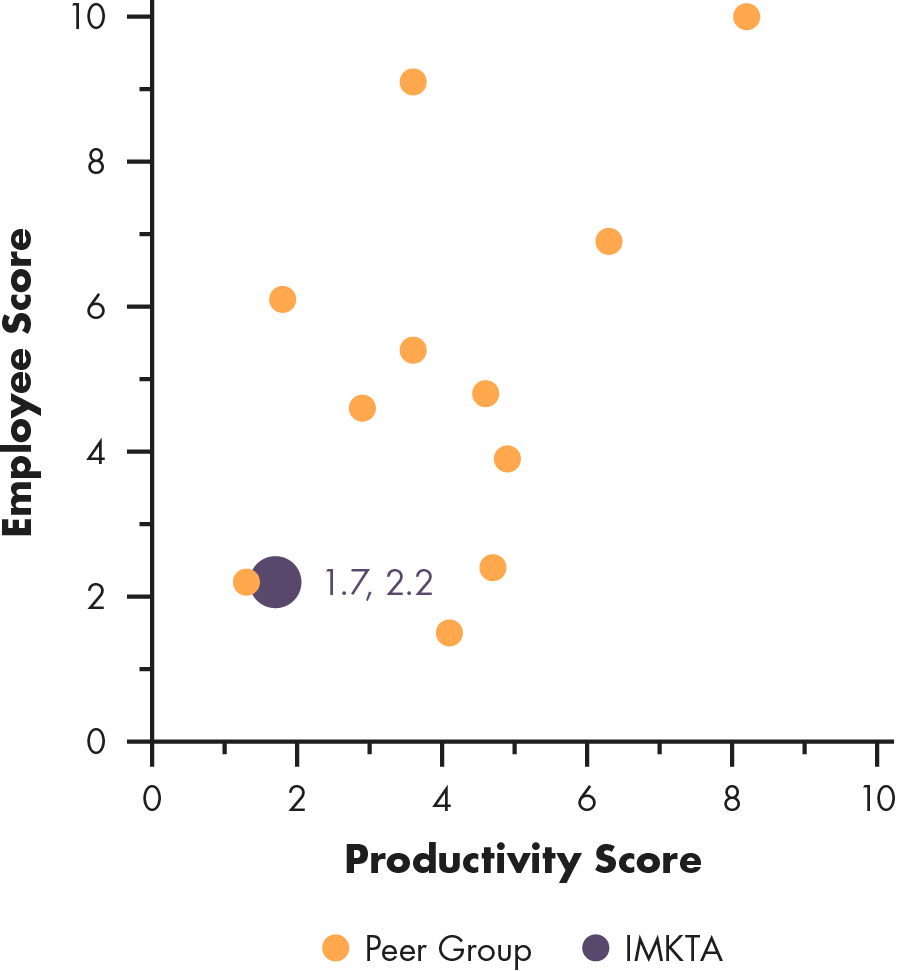
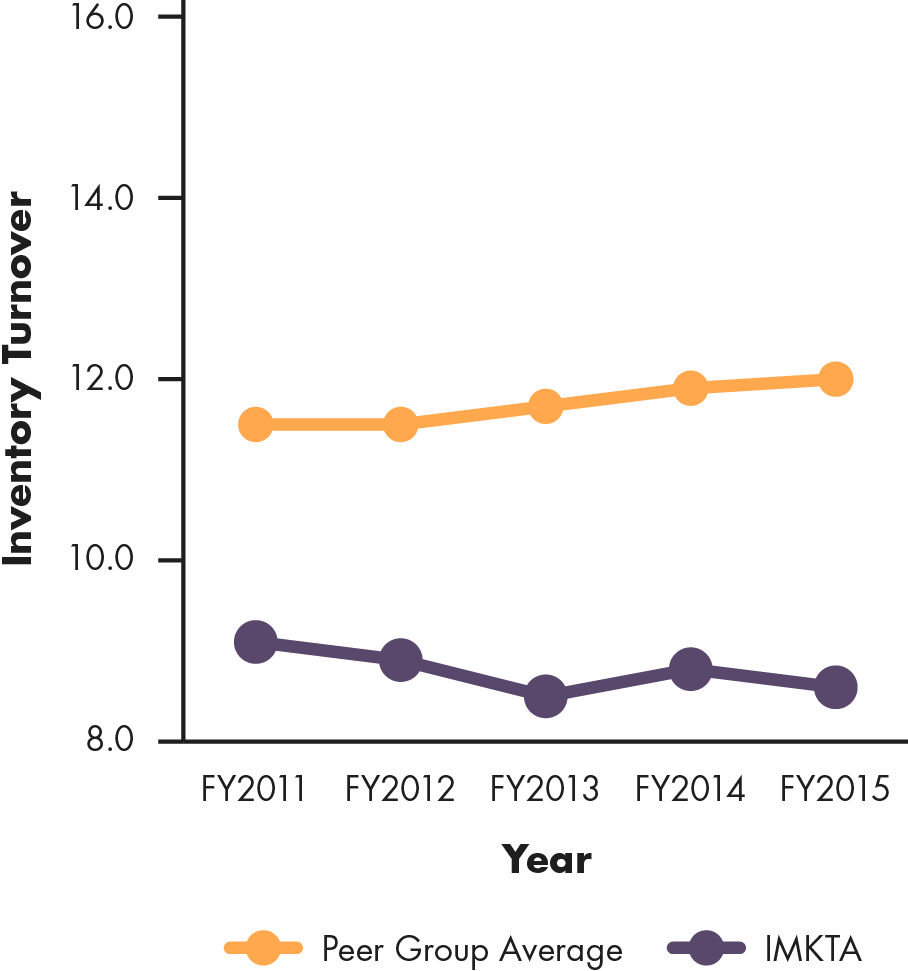
Ingles Market (NASDAQ:IMKTA)
Ingles Market is a publicly traded grocery store chain operating with 201 stores located principally in the south-east United States. The chain’s 2015 revenue dropped from 2014 to $3.77 billion while it grew its headcount to 25,000 employees. Ingles Market does not report their average number of SKUs, but they carry an assortment of grocery items including fresh produce, flowers and gifts, pharmacy items, health and beauty products and general merchandise. The Ingles Market mission is to provide customers with outstanding selection and value, the highest quality products and superior customer service. Inspired by the “small town values” upon which the company began, they remain dedicated to their customers, associates, and communities.
Ingles Market’s Good Jobs Score Overview |
||
|---|---|---|
| Overall Score: 3.0Overall Rank: #10 | ||
|
Customer/Employee Scores
|
Productivity/Customer Scores
|
Productivity/Employee Scores
|
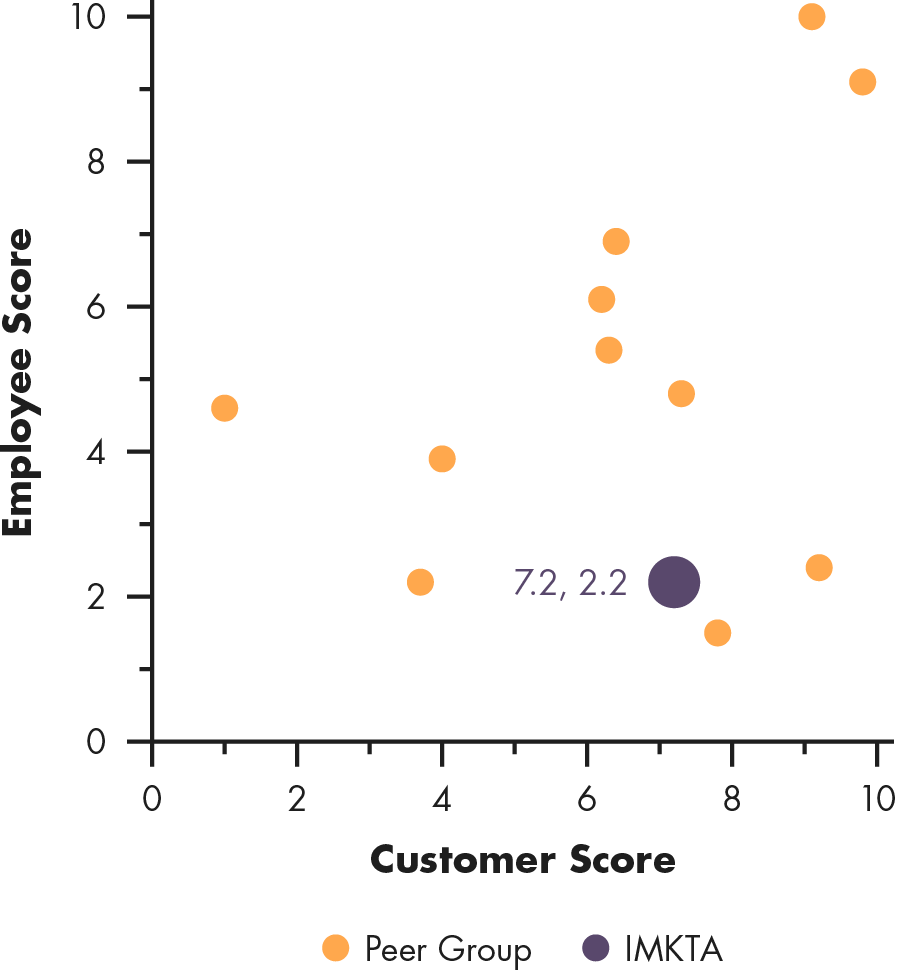
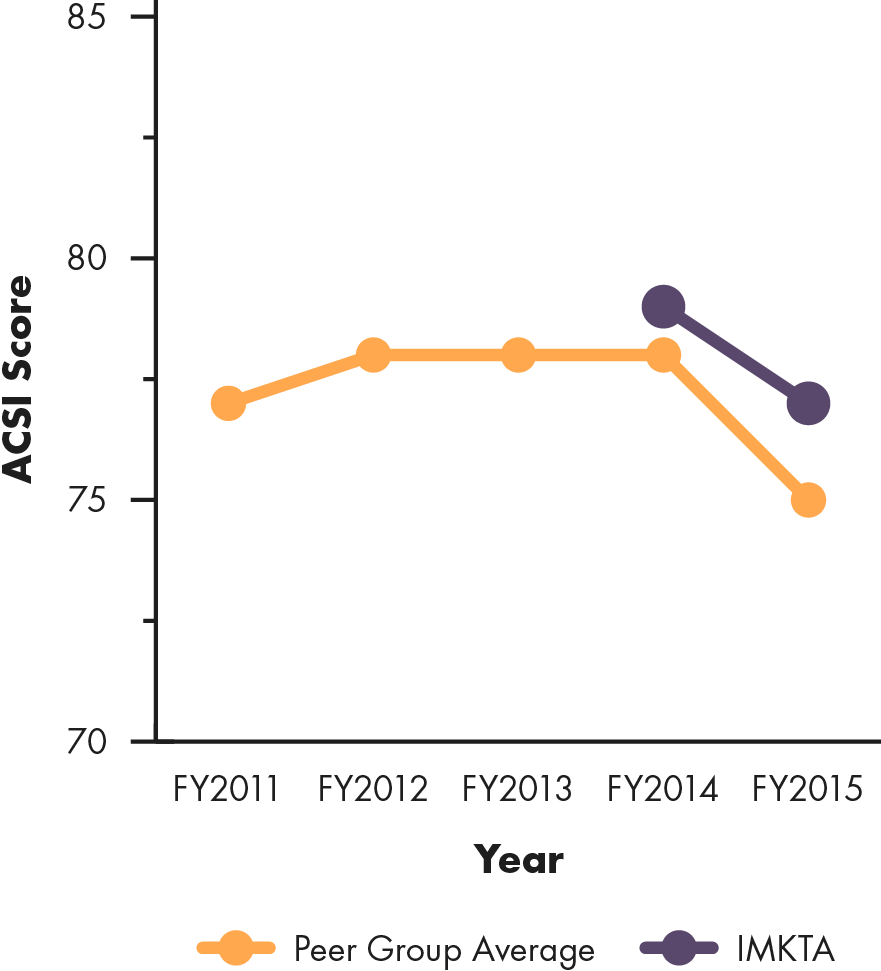
Ingles Market’s Customer Score |
||
|---|---|---|
| Customer Score: 7.2Customer Rank: #6 | ||
| For 2016, the Good Jobs Customer component is composed of ASCI and Yelp scores. The 2015 score include Consumer Reports data, unavailable this year due it the biennial schedule of the report. Some companies only have two years of ACSI trend data – these companies are not tracked by the index; their scores are generated by predicting what their scores would have been using their relationship to Yelp data. |
ACSI Trend |
|
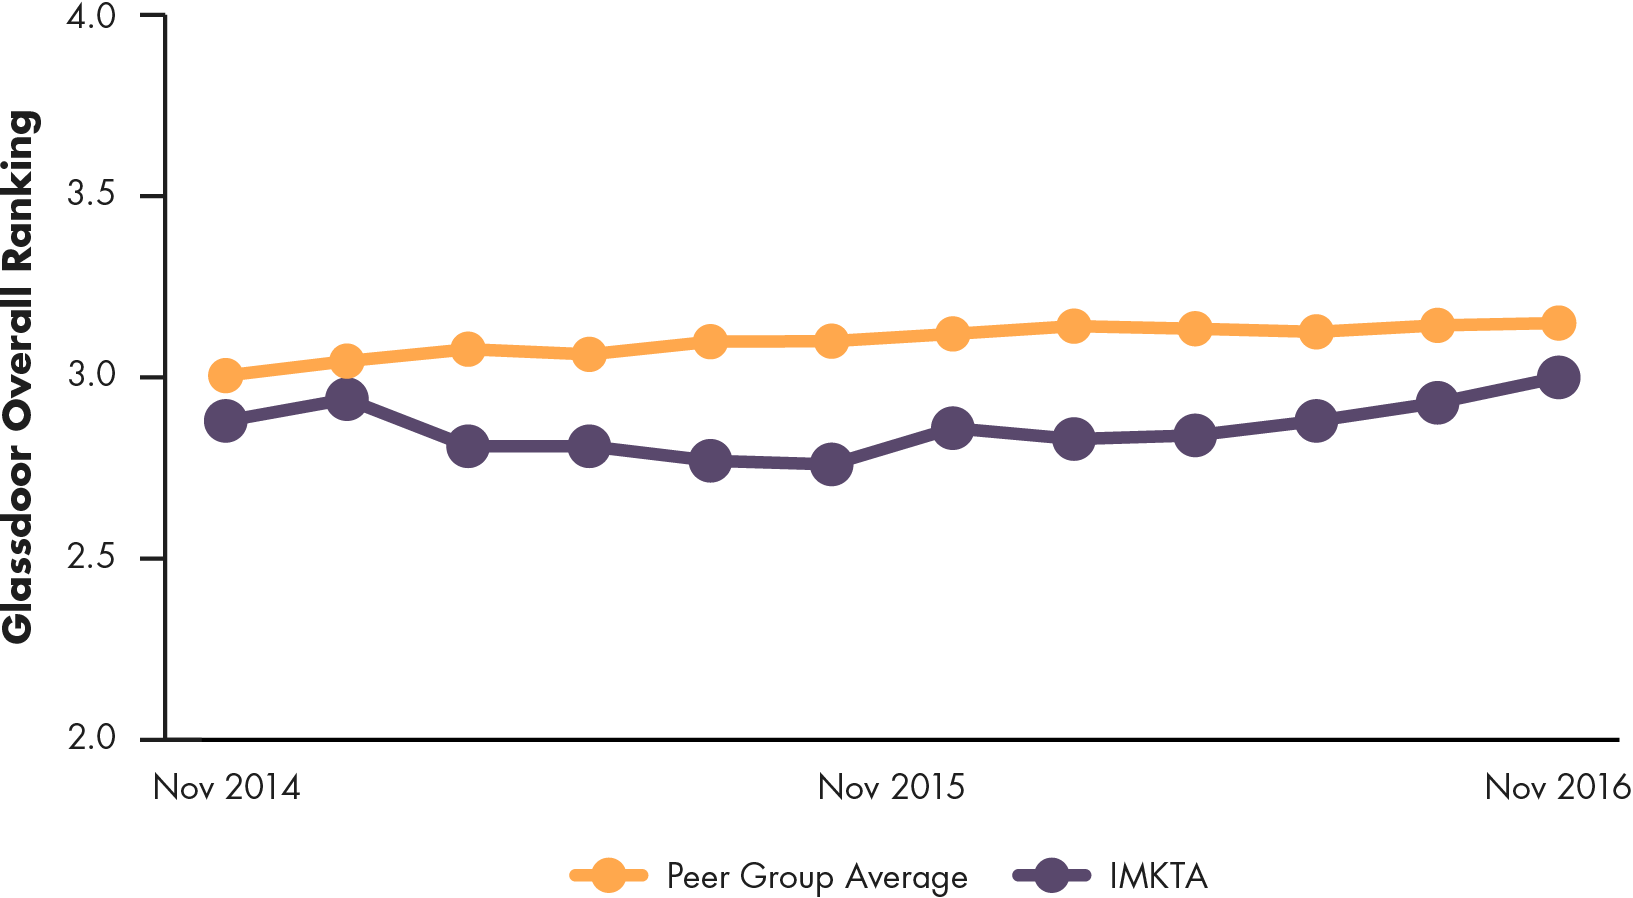
Ingles Market’s Employee Score |
||
|---|---|---|
| Employee Score: 2.2Employee Rank: #10 | ||
| The Good Jobs Employee component is a composite of Glassdoor and Indeed scores (see Methodology for more details). Glassdoor provides a 2-year trailing score trend, republished here with the peer group average for comparison. |
Ingles Market’s Glassdoor Rating Trend |
|
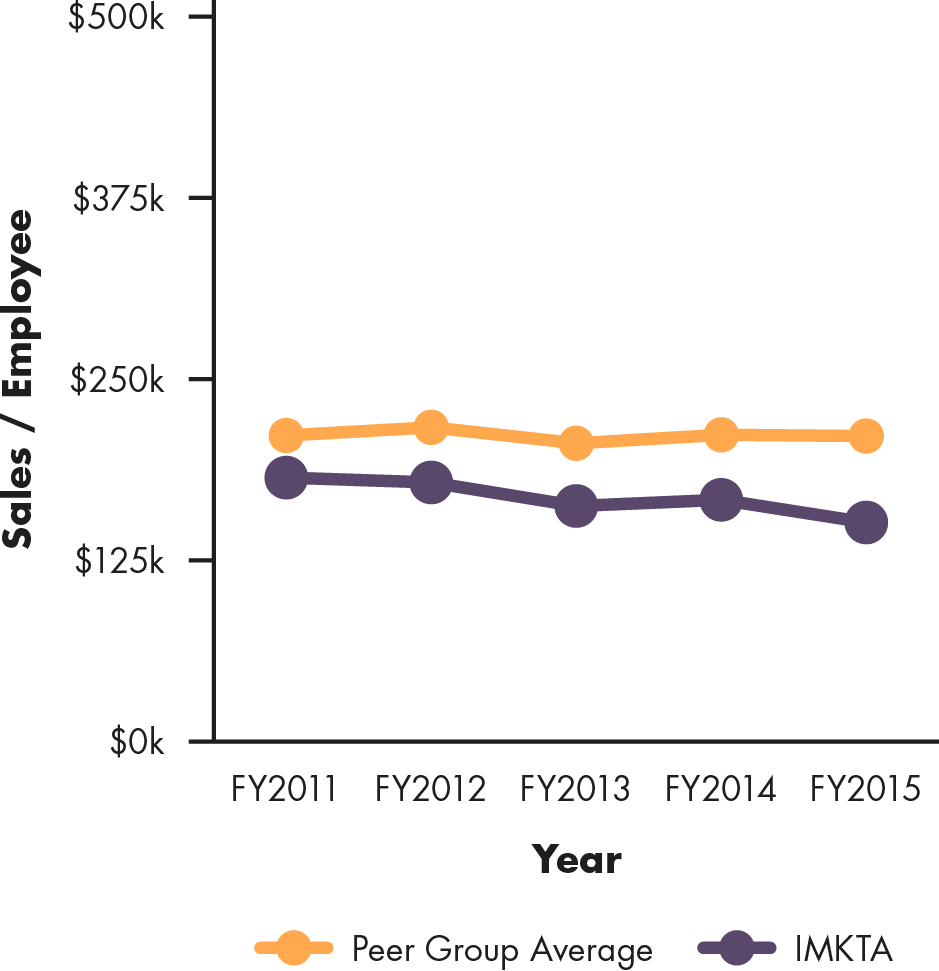
Ingles Market’s Productivity Score |
||
|---|---|---|
| Productivity Score: 1.7Productivity Rank: #11 | ||
|
Sales/SQFT
|
Sales/Employee
|
Inventory Turnover
|

Walmart (NYSE:WMT)
Walmart is a publicly traded retail store chain operating under two banners: Walmart U.S. (4,574 stores) and Sam’s Club (655 stores). Walmart’s U.S. revenue in 2015 was $298 billion, and Sam’s Club revenue was $56.8 billion. They employed approximately 1,500,000. Each Walmart operated store carries an average of 140,000 SKUs, with items ranging from canned non-perishable groceries to televisions. Sam’s Club has a more limited selection of products. Walmart’s mission is to save people money so they can live better.
Walmart’s Good Jobs Score Overview |
||
|---|---|---|
| Overall Score: 2.4Overall Rank: #11 | ||
|
Customer/Employee Scores
|
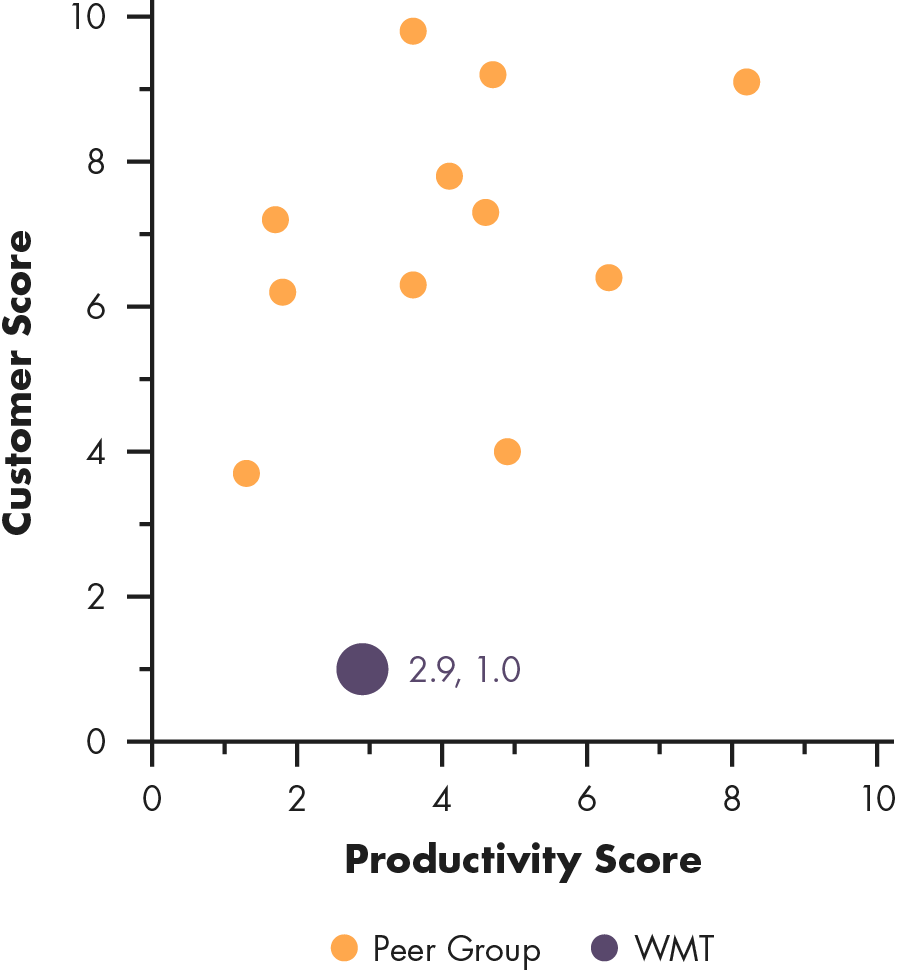
Productivity/Customer Scores
|
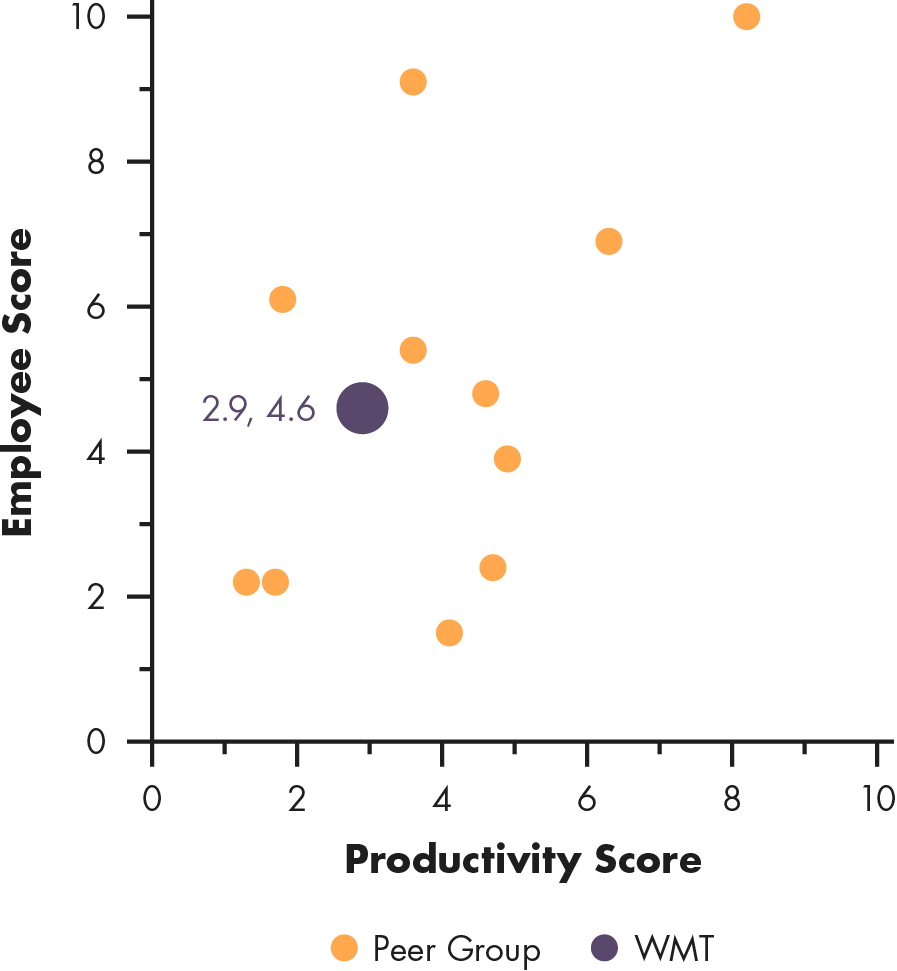
Productivity/Employee Scores
|
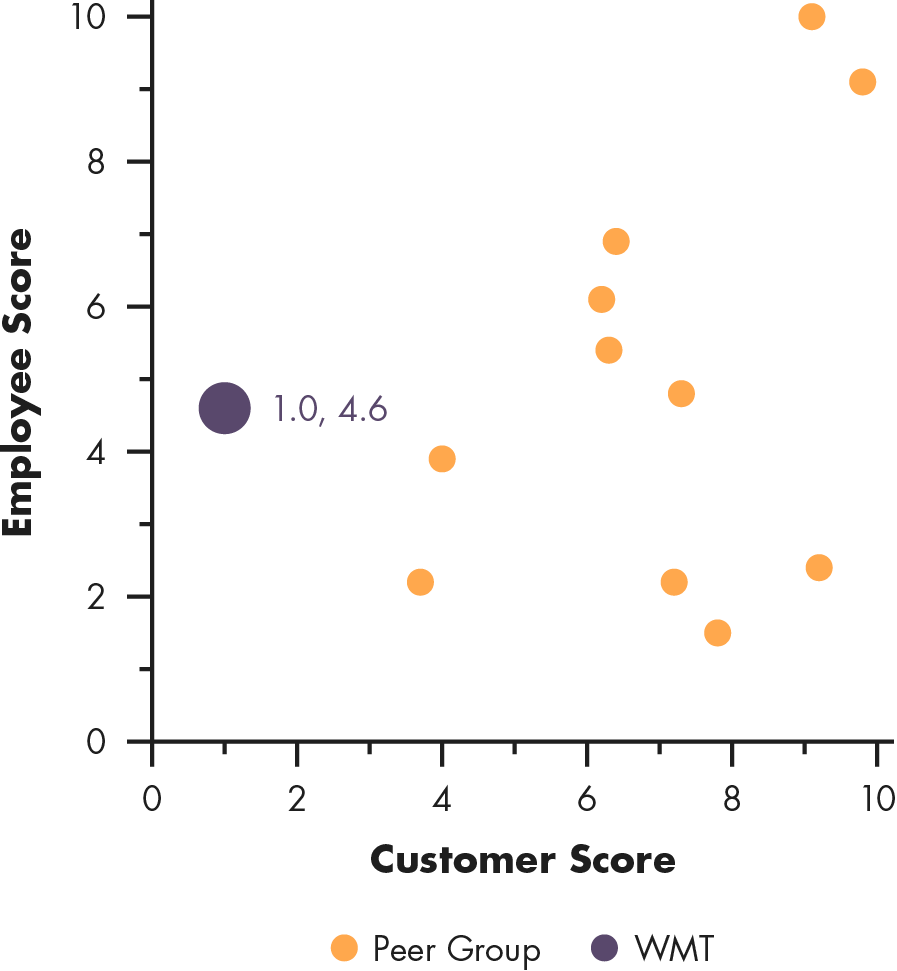
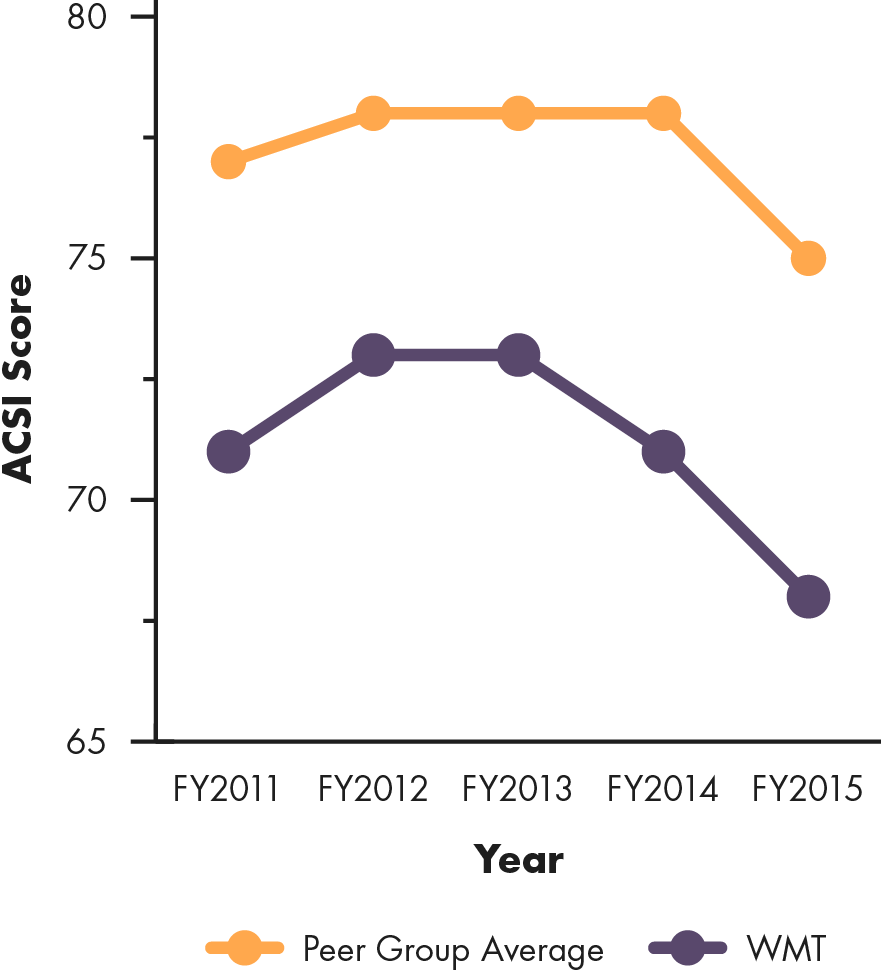
Walmart’s Customer Score |
||
|---|---|---|
| Customer Score: 1.0Customer Rank: #12 | ||
| For 2016, the Good Jobs Customer component is composed of ASCI and Yelp scores. The 2015 score include Consumer Reports data, unavailable this year due it the biennial schedule of the report. Some companies only have two years of ACSI trend data – these companies are not tracked by the index; their scores are generated by predicting what their scores would have been using their relationship to Yelp data. |
ACSI Trend |
|
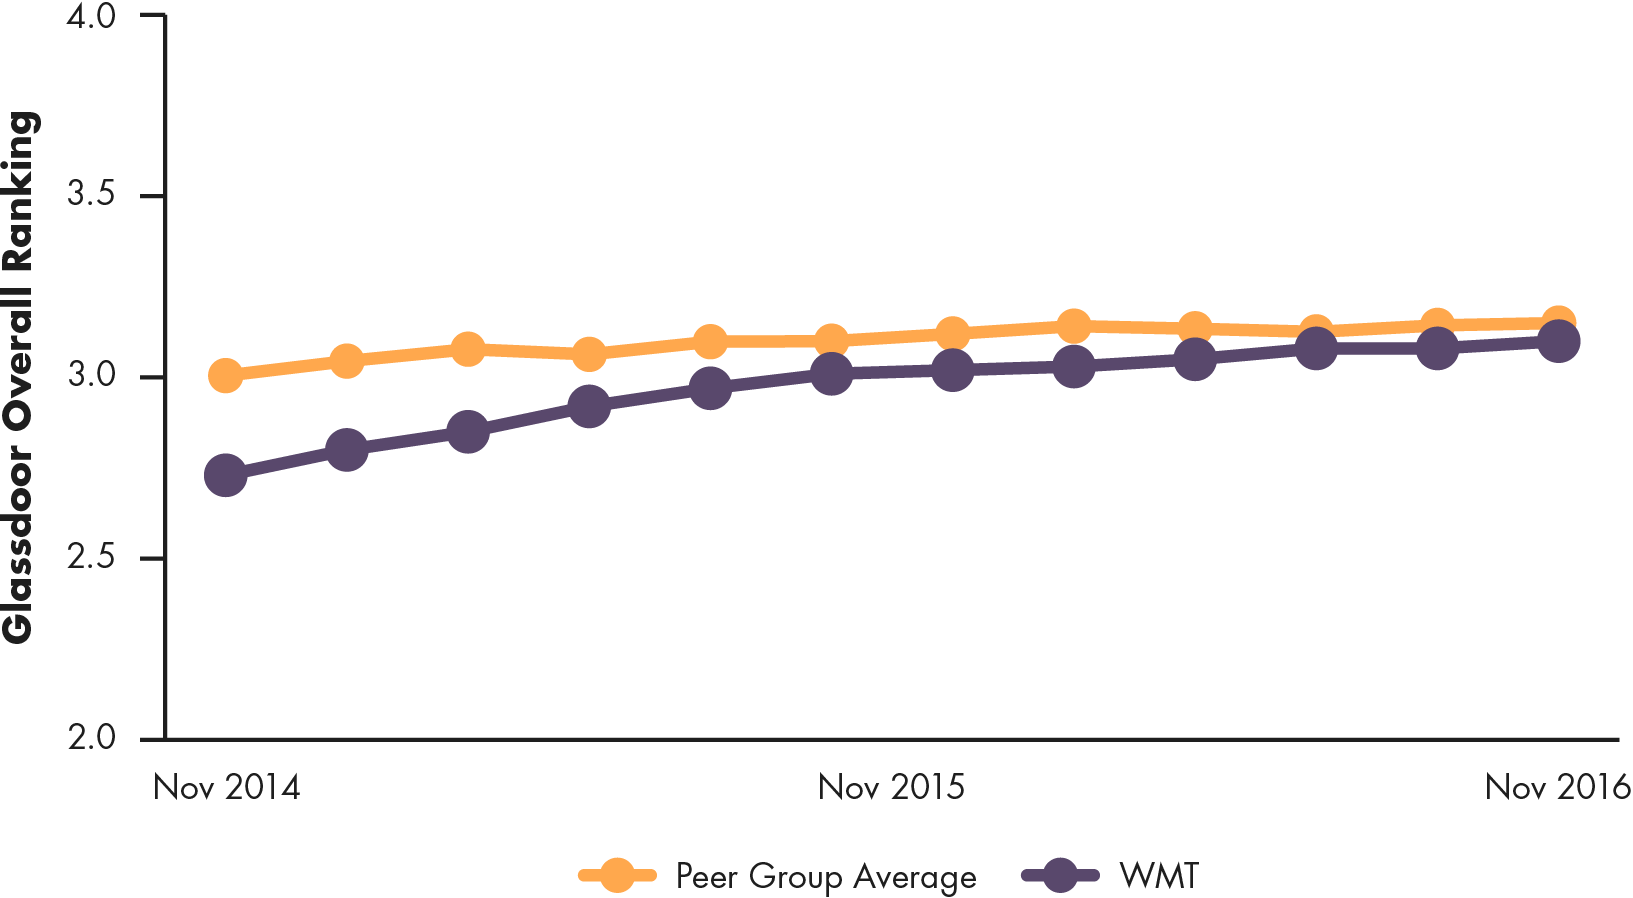
Walmart’s Employee Score |
||
|---|---|---|
| Employee Score: 4.6Employee Rank: #7 | ||
| The Good Jobs Employee component is a composite of Glassdoor and Indeed scores (see Methodology for more details). Glassdoor provides a 2-year trailing score trend, republished here with the peer group average for comparison. |
Walmart’s Glassdoor Rating Trend |
|
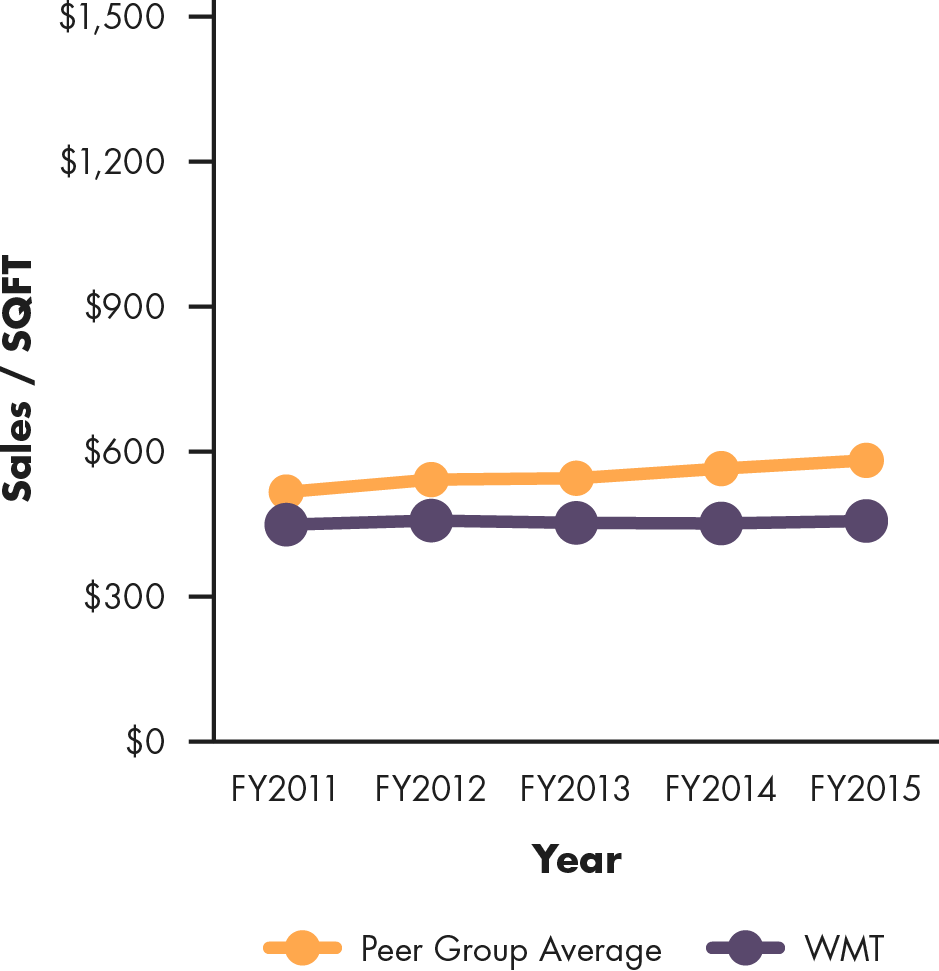
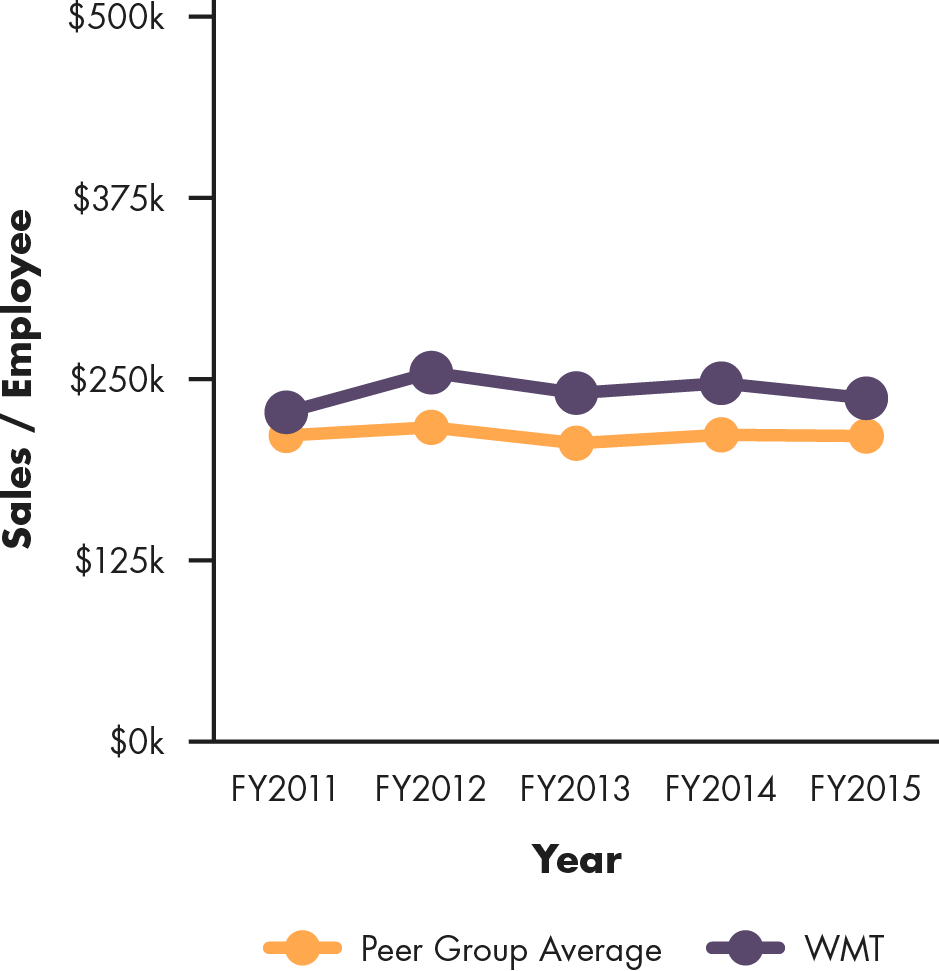
Walmart’s Productivity Score |
||
|---|---|---|
| Productivity Score: 2.9Productivity Rank: #9 | ||
|
Sales/SQFT
|
Sales/Employee
|
Inventory Turnover
|
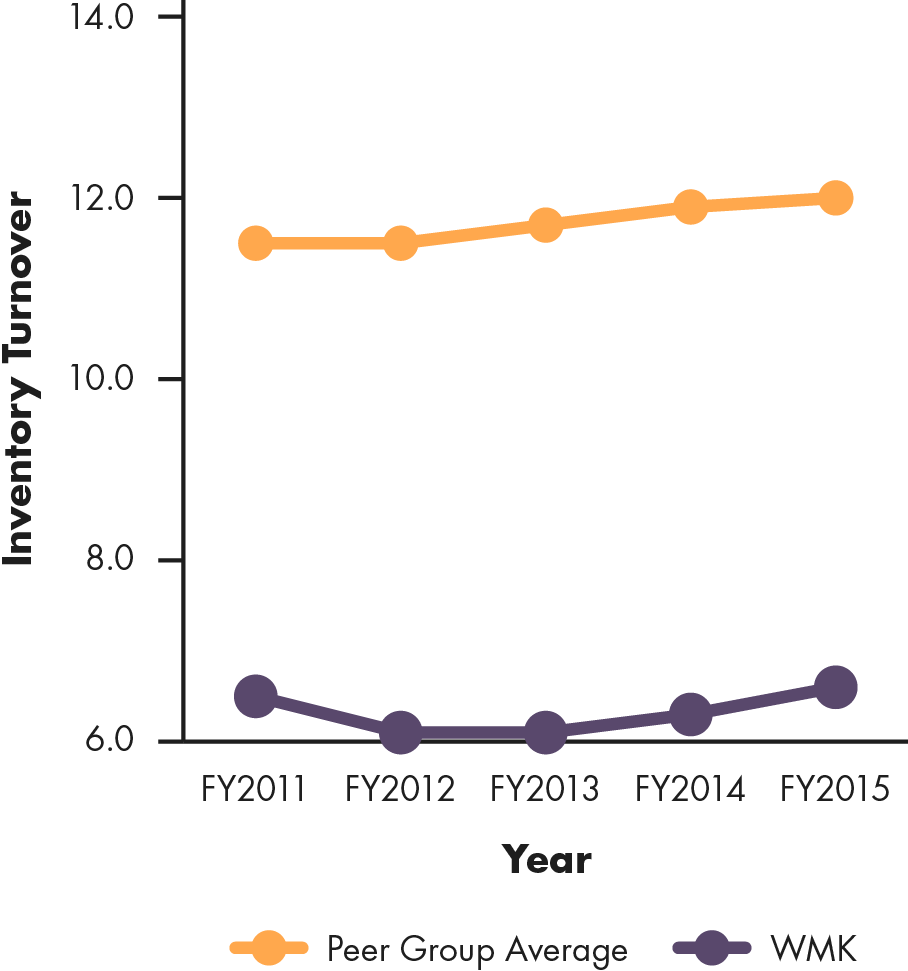
Weis Markets (NYSE:WMK)
Weis Markets is a publicly traded grocery store chain operating along the eastern seaboard of the United States. 2015 revenue was $2.9 billion across 163 stores and 19,000 employees. Weis Markets does not report their average number of SKUs, but they carry an assortment of grocery items including fresh produce, flowers and gifts, pharmacy items, and health and beauty products. Their mission states that they deliver an exceptional shopping experience by offering the best service, value, quality, and freshest products while being good stewards of the environment and giving back to the communities they serve.
Weis Markets’ Good Jobs Score Overview |
||
|---|---|---|
| Overall Score: 2.2Overall Rank: #12 | ||
|
Customer/Employee Scores
|
Productivity/Customer Scores
|
Productivity/Employee Scores
|
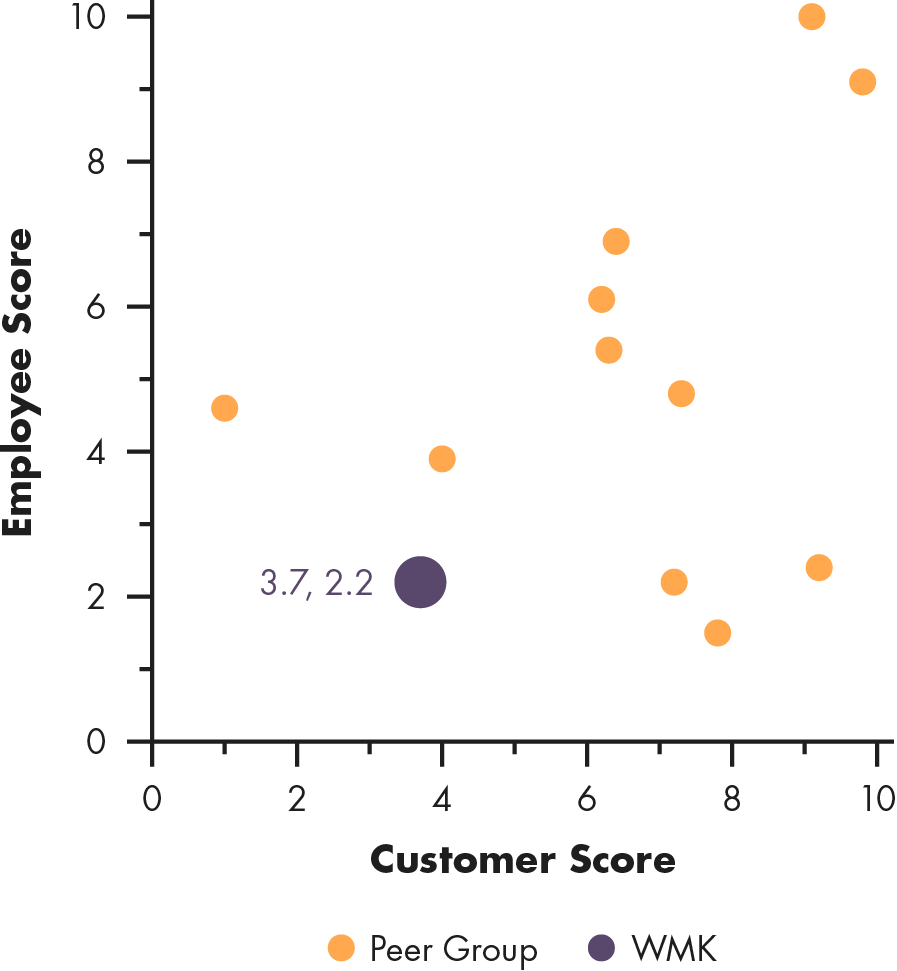
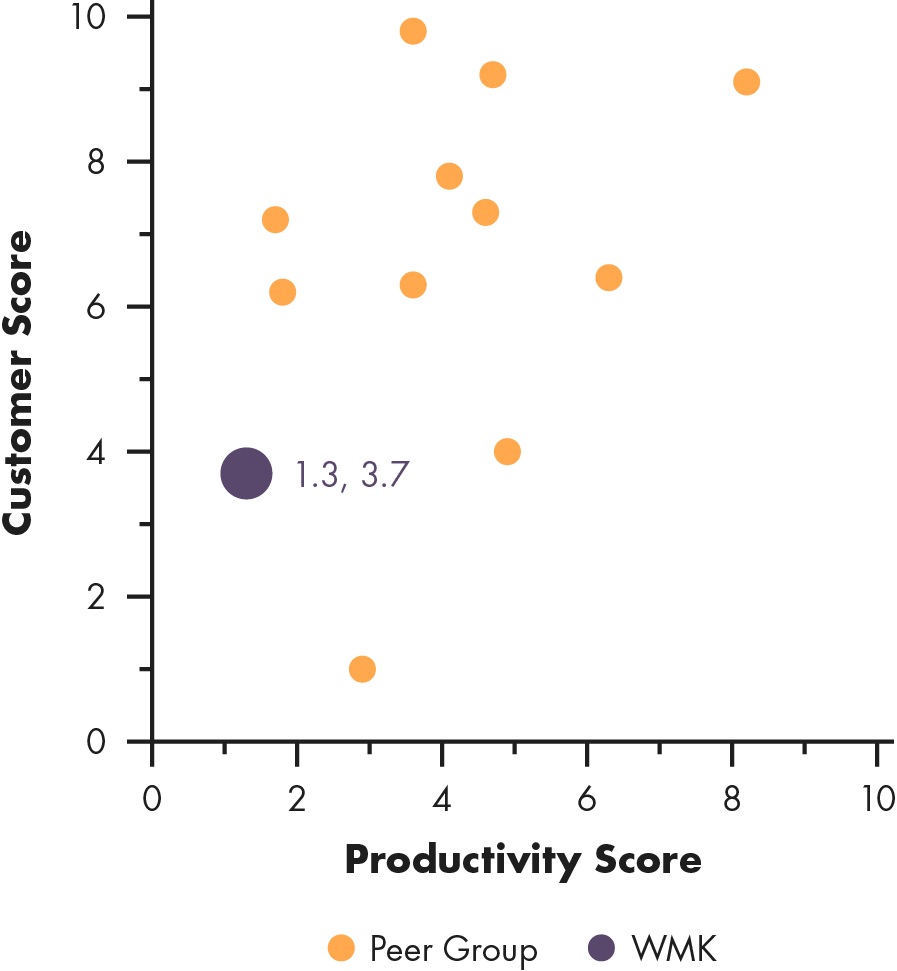
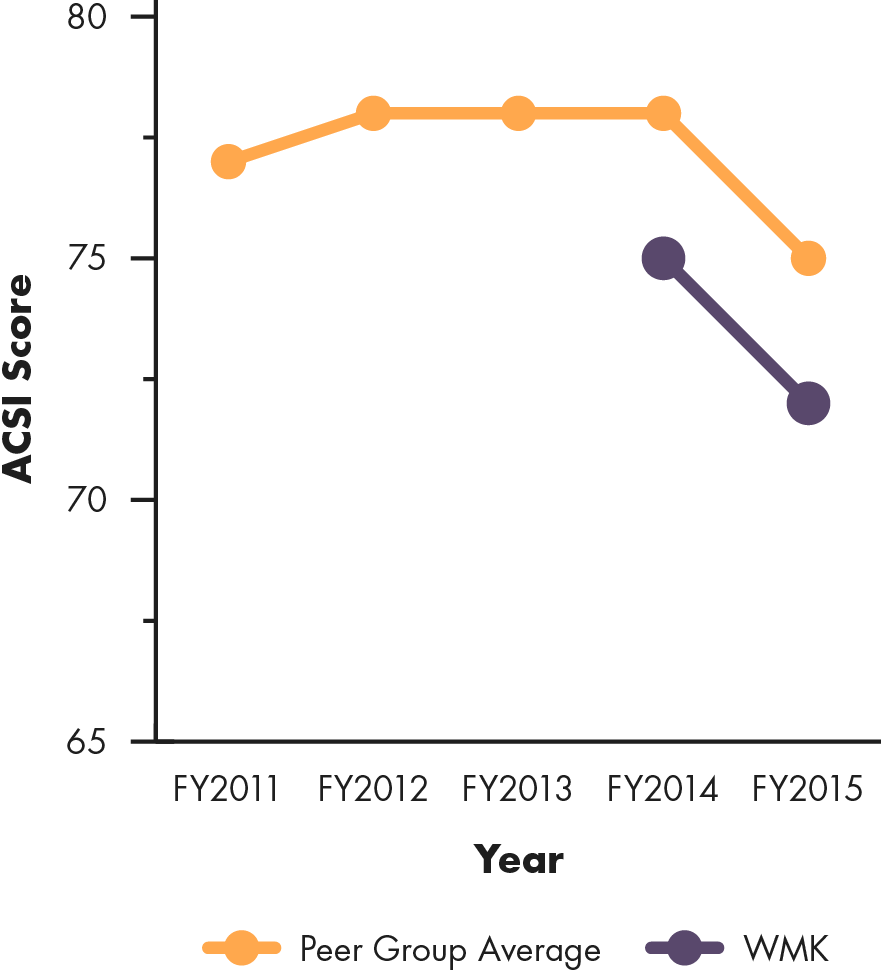
Weis Markets’ Customer Score |
||
|---|---|---|
| Customer Score: 3.7Customer Rank: #11 | ||
| For 2016, the Good Jobs Customer component is composed of ASCI and Yelp scores. The 2015 score include Consumer Reports data, unavailable this year due it the biennial schedule of the report. Some companies only have two years of ACSI trend data – these companies are not tracked by the index; their scores are generated by predicting what their scores would have been using their relationship to Yelp data. |
ACSI Trend |
|
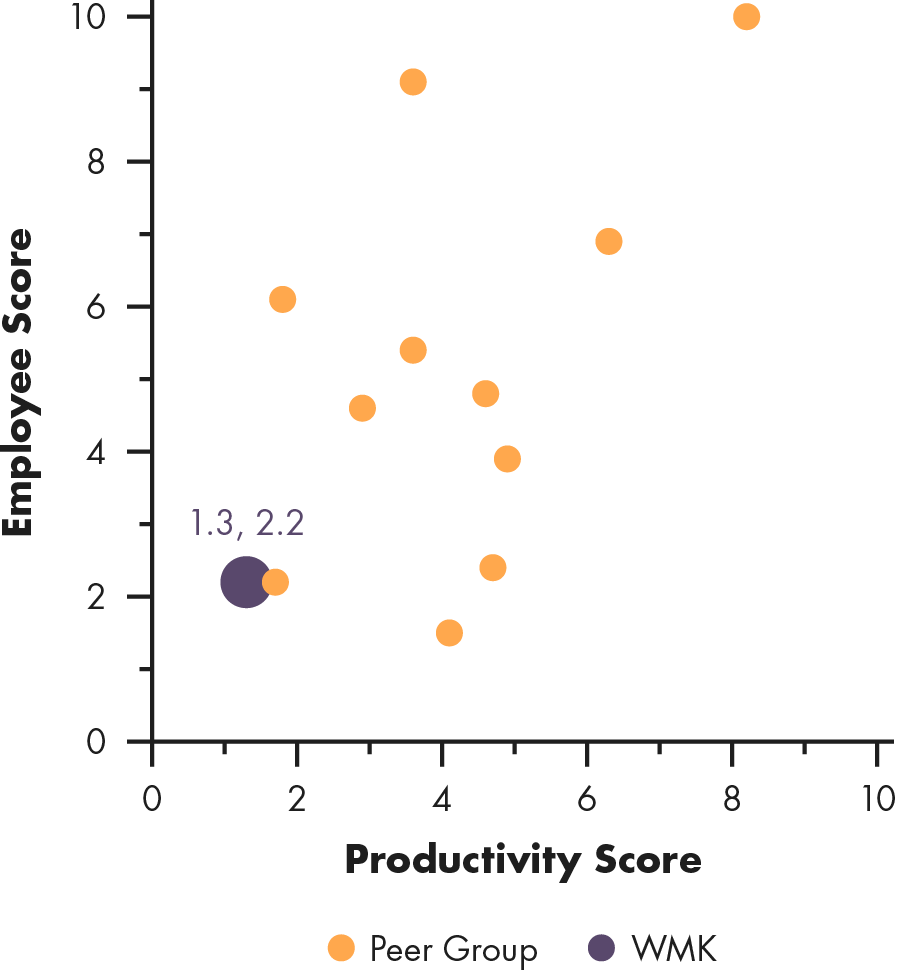
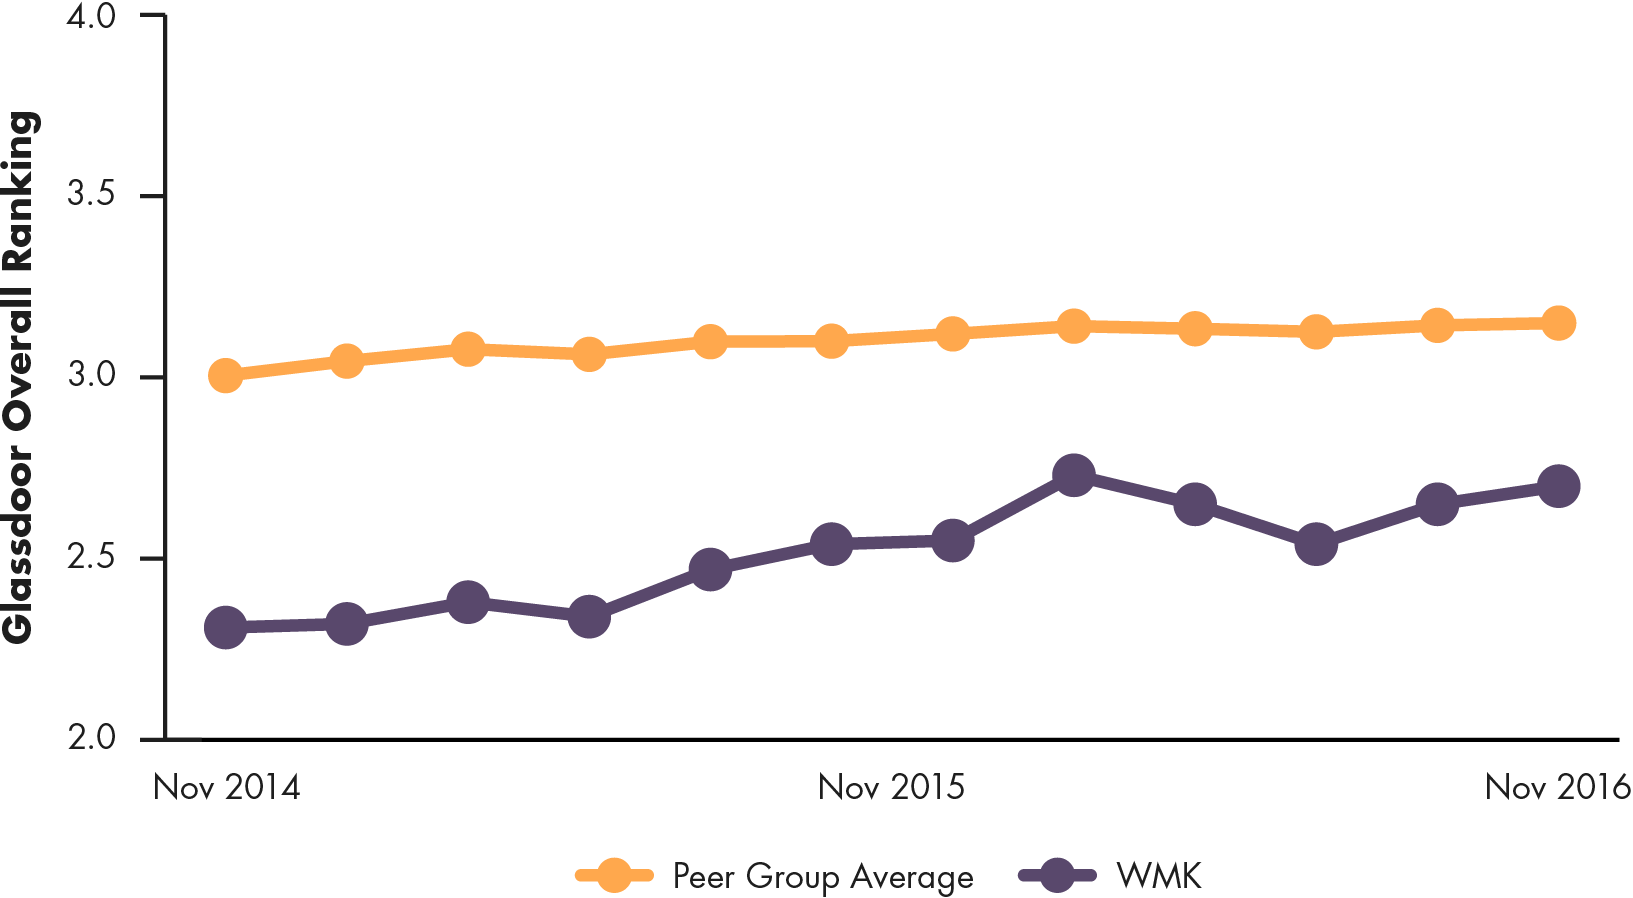
Weis Markets’ Employee Score |
||
|---|---|---|
| Employee Score: 2.2Employee Rank: #10 | ||
| The Good Jobs Employee component is a composite of Glassdoor and Indeed scores (see Methodology for more details). Glassdoor provides a 2-year trailing score trend, republished here with the peer group average for comparison. |
Weis Markets’ Glassdoor Rating Trend |
|
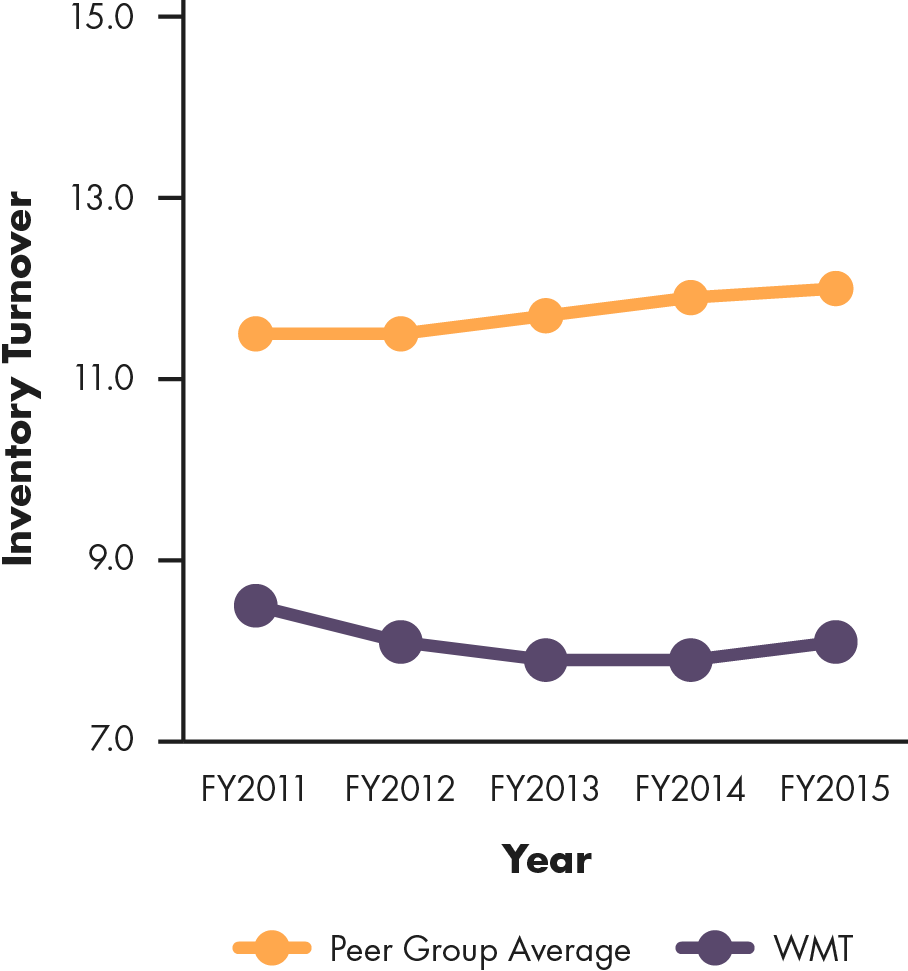
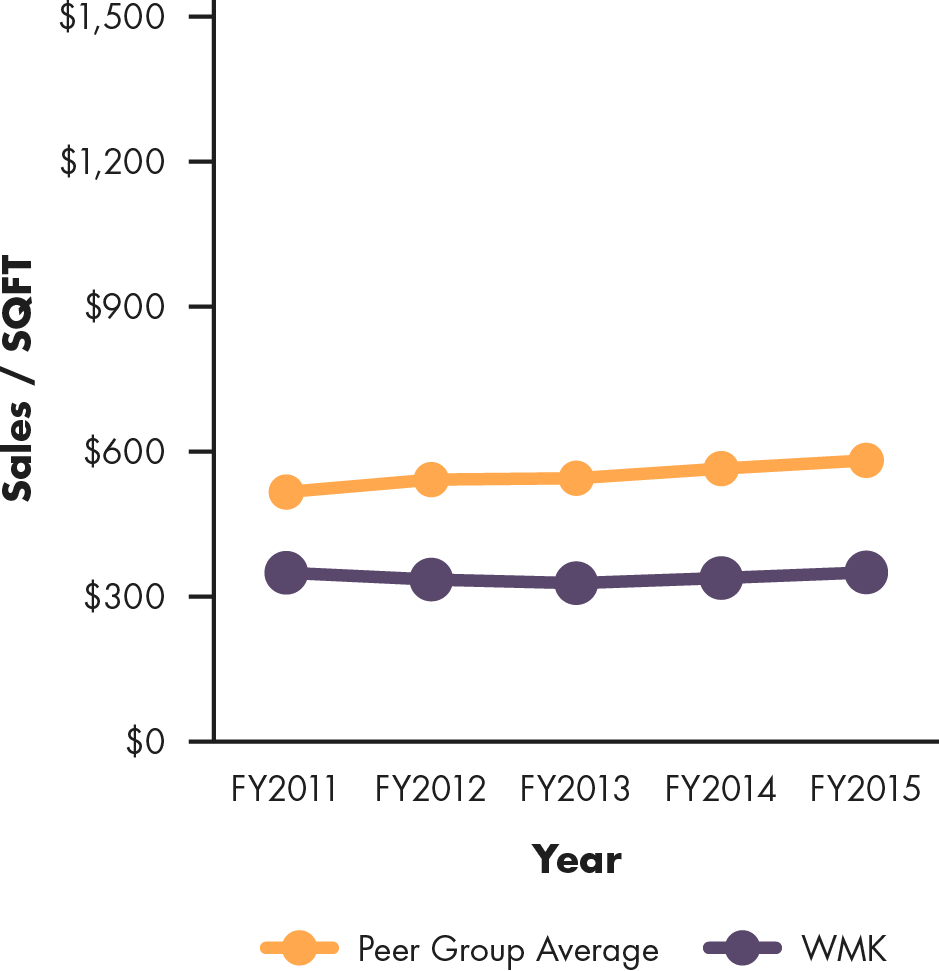
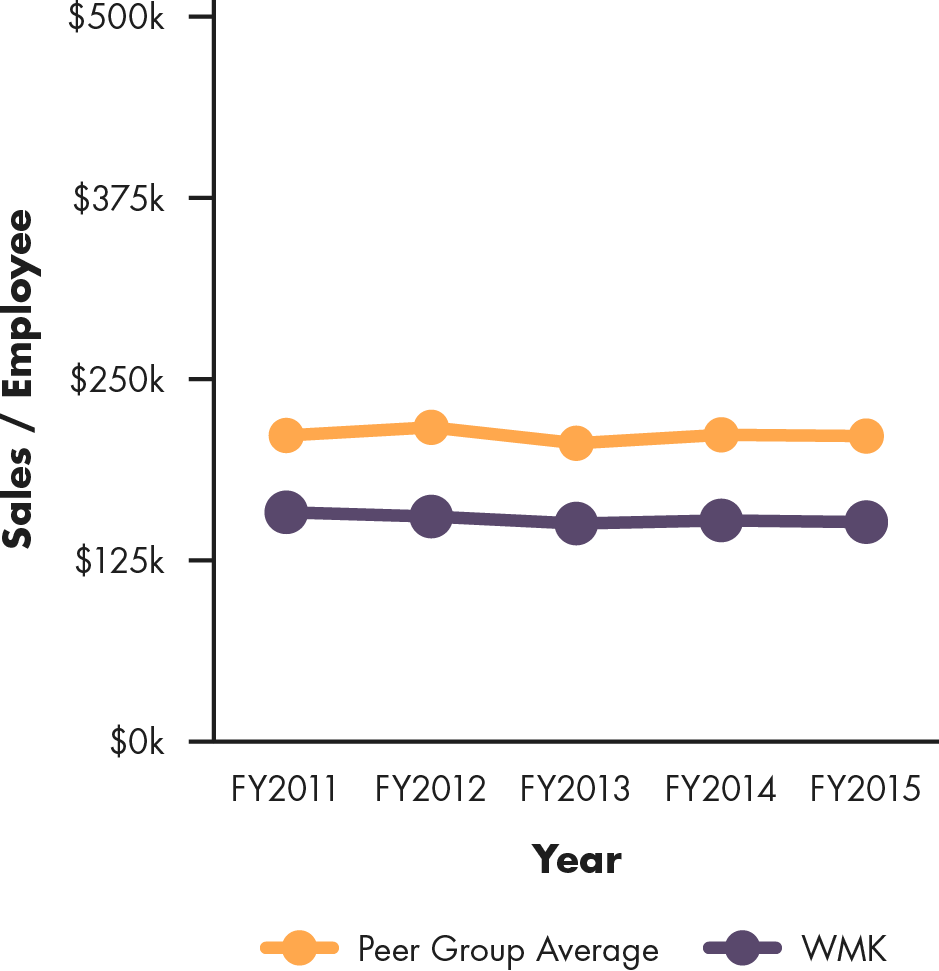
Weis Markets’ Productivity Score |
||
|---|---|---|
| Productivity Score: 1.3Productivity Rank: #12 | ||
|
Sales/SQFT
|
Sales/Employee
|
Inventory Turnover
|
Note: Unlike the 2015 Score, there was no Consumer Reports ratings. Consumer Reports ratings will return next year.
The information disclosed on this website (1) does not represent the views or opinions of the Massachusetts Institute of Technology or the University of Toronto, which takes no institutional position on the goods, services, or business or employment practices of the organizations named herein; and (2) is not, and should not be treated as, investment advice or recommendation. Brand names, logos, and trademarks used within this website are the property of their respective owners.